All the hype today is about Data and Big Data, but this notion may seem a bit elusive. My students sometimes struggle understanding the difference between “data” and “literature”, perhaps because of the unfortunate habit to call library portals “databases”. Even colleagues are sometimes uncomfortable with the notion of data (whether “big” or “small”) and the breadth it is now taking. So, a definition can be helpful.
Data are pieces of unprocessed information – more precisely raw indicators, or basic markers, from which information is to be extracted. Untreated, they hardly reveal anything; subject to proper analysis, they can disclose the inner working of some relevant aspects of reality.
The “typical” example of socioeconomic data is the observations/variables matrix, where each row represents an observation – an individual in a population – and each column represents a variable – a particular indicator about that individual, for example age, gender, or geographical location. (In truth data types are more varied and may also include unstructured text, images, audio and video; But for the sake of simplicity, let’s stick to the Matrix here.)

Now, look at this matrix: in itself, and as such, it gives us no clue whatsoever as to the social process that generated it!
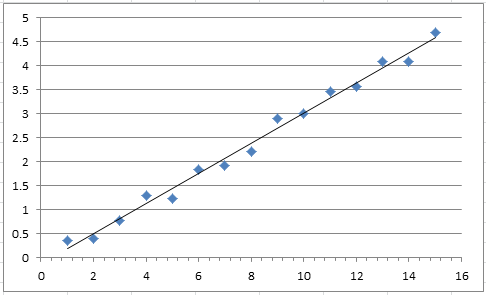
But analytical techniques – from descriptive histograms and trend lines to all sorts of regressions – help us make sense of it. We can see, for example, that two variables move together: Whenever one goes up, the other goes up too. This enables saying something meaningful about reality – like, if we notice that more years of schooling correlates with higher earnings (a favorite example of econometrics courses!).
So, data is something that has to do with information, but is not ready-for-use information; To be of any use, it needs analytical work of some kind. Which is why, dear students, an article or a report are NOT data… at least not as such.
