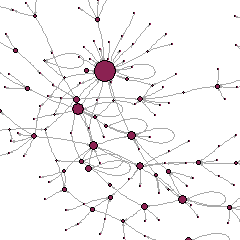
 Network data are among those that are changing fastest these days. When I say I study social networks, people almost automatically think of Facebook or Twitter –without necessarily realizing that networks have been around for, well, the whole history of humanity, long before the internet. Networks are just systems of social relationships, and as such, they can exist in any social context — the family, school, workplace, village, church, leisure club, and so forth. Social scientists started mapping and analysing networks as early as the 1930s. But people didn’t think of their social relationships as “networks” and didn’t always see themselves as “networkers” even if they did invest a lot in their relationships, were aware of them, and cared about them. The term, and the systemic configuration, were just not familiar. There was something inherently informal and implicit about social ties.
What has changed with Facebook and its homologues, is that the network metaphor has become explicit. People are now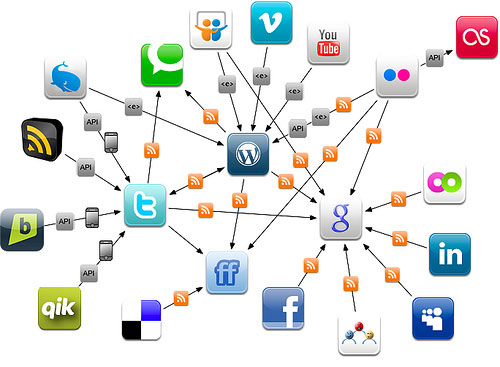 accustomed to talking about “networks”, and think in systemic terms, seeing their own relationships as part of a more global structure. Network ties have become formal — you have to make a clear choice and action when you add a “friend” on Facebook, or “follow” someone on Twitter; you will have a list of your friends/followers/followees (whatever the specific terminology is) and monitor changes in this list. You know who the friends of your friends are, and can keep track of how many people viewed your profile /included you in their “lists” / mentioned you in their Tweets. Now, everyone knows what networks are –so if you are a social network researcher and conduct a survey like in the old days, you won’t fear your respondents may misunderstand. In fact, you may not even need to do a survey at all –the formal nature of online ties, digitally recorded and stored, makes it possible to retrieve your network information automatically. You can just mine network tie data from Facebook, Twitter, or whatever service your target populations happen to be using.
Continue reading “Network data, new and old: from informal ties to formal networks”


