We know this now: artificial intelligence is not only a Silicon Valley product. When trying to look further, research and the media have found AI’s “hidden workforce” (the data workers who label images, transcribe audio, and evaluate content to train machine learning models) in countries like Kenya, the Philippines, Venezuela, and Madagascar.
In a new study, led by Myriam Raymond and with the collaboration of Antonio A. Casilli and Lucy Neveux, we lift the veil on data work in Egypt. Over 600 questionnaires, 15 focus groups, and an online ethnography reveal the substantial contribution of this country to AI technologies produced and marketed overseas. Egypt’s position in the global AI supply chain is unique, as it serves technology companies both in the Western world (Europe and North America) and in China, often through intermediaries based in the Gulf.
As already observed in other countries, these workers are mostly young: three quarters are below 34 years of age. They live mostly in urban areas. They are also highly educated: in particular, three out of five have an undergraduate degree in science or technical fields. Another notable similarity concerns low pay and lack of protections. We find that four out of five data workers undertake this activity out of financial need, and they spend the income earned in this way immediately on rent, food, and clothes. On average, though, data work pays less than half the country’s monthly minimum wage, and earnings are highly volatile.
The gender gap is more acute than observed elsewhere. Three workers out of four are men. The few female data workers are more dependent on this activity: data work is the only job for two out of ten of them (against one in ten men). Women face unique barriers, reflecting locally-grounded cultural constraints and concerns about online safety.
More generally, culture and morals play an important role in the perceptions that Egyptian workers have of their activity – in ways that had not emerged so forcefully in other countries before. Data tasks sometimes conflict with their principles and beliefs, prompting them to continually question and, at times, reshape their digital identities.
There are two main ways in which a discipline like sociology engages with artificial intelligence (AI) and is affected by it. In a previous post, I discussed how the sociology of AI understands technology as embedded in socio-economic systems and takes it as an object for research. Here, focus is on sociology with AI, indicating that the discipline is integrating AI into its methodological toolbox.
AI technologies were designed for other-than-research purposes, but they may be repurposed. The editors of a special issue of Sociologica last year stress that, ten years ago, digital methods presented similar challenges: for example, using tweets to make claims about the social world required us to understand how people used Twitter in the first place. We also needed to understand which people used Twitter at all, and what spaces of action the architecture and Terms of Use of this platform allowed. Likewise, using AI technologies can serve sociologists insofar as efforts are made to understand the technological (and socio-economic) conditions that produced them. Because AI systems are typically blackboxed, this requires, to begin with, developing exploration techniques to navigate them. For example, the plot below is from a recent paper that asked five different LLMs to generate religious sermons and compared the results (readability scores) by religious traditions and race. It finds that Jewish and Muslim synthetic sermons were constructed with significantly more difficult reading levels than were those for evangelical Protestants, and that Asian religious leaders were assigned more difficult texts than other groups. It is a way to uncover how models treat religious and racial groups differently, although it remains difficult to detect precisely which factors affect this result.
Robust regression coefficients predicting readability scores by religion, race, and model. Source: Tom J.C., Ferguson T.W. & Martinez B.C. 2025. Religion and racial bias in Artificial Intelligence Large Language Models. Socius: Sociological Research for a Dynamic World, 11. https://doi.org/10.1177/23780231251377210
That said, how can AI help us methodologically? To answer this question, it is useful to look at qualitative and quantitative approaches separately. Qualitative research, traditionally viewed and practiced as an intensely human-centred method, may seem at first sight incompatible with it. However, use of computer-assisted qualitative data analysis (with tools such as Nvivo) is now common among qualitative researchers, though it faced some degree of scepticism at the beginning. Attempts to leverage AI move forward this agenda, and the most common application so far is automated transcription of interviews through speech recognition technologies. AI-powered tools make this otherwise tedious task more efficient and scalable. A recent special issue of the International Journal of Qualitative Methods maps a variety of other usages, less common and more experimental: for example, considering that even the best models for audio transcription are not as accurate as humans, LLMs appear as tools to facilitate and speed up transcription cleaning. There are also some attempts at using LLMs as instruments for coding and thematic analysis: for example, some authors have examined inter-coder reliability between ‘human only’ and ‘human-AI’ approaches. Others have used AI image generation like vignettes – as a tool for supporting interview participants in articulating their experiences. Overall, the use of AI remains experimental and marginal in the qualitative research community. Those who have undertaken these experiments find the results encouraging, but not perfect.
In quantitative research, some AI tools are already (relatively) widely used: in particular, natural language processing (NLP) to process textual data like corpora from the press or media. More recent applications leverage generative AI, especially large language models (LLM). Outside practices like literature review and code generation/debugging, which are common to multiple disciplines, three applications are specifically sociological and worth mentioning. First, in experimental research, there are some attempts to examine how the introduction of AI agents in interaction games shapes the behaviour of the humans they play with. As discussed by C. Bail in an insightful PNAS article, the extent to which generative AI is capable of impersonating humans is nevertheless subject to debate, and it will probably evolve over time. Second, L. Rossi and co-authors outline that in agent-based models (ABM), an idea is to use LLMs to create agents that are more capable of capturing a larger spectrum of human behaviours. While this approach may provide more realistic descriptions of agents, it re-ignites a long-standing debate in the field: indeed, many believe that increasing the complexity of agents is undesirable when emergent collective dynamics can emerge from more parsimonious models. It is also unclear how the performance of LLMs within ABMs should be evaluated. Shall we say that they are good if they reproduce known collective dynamics within ABMS? Or, should they be assessed based upon their capacity to predict real-world outcomes? Third, in survey research, the question has arisen whether LLMs can simulate human populations for opinion research. Some studies have tested this possibility, with mixed results. The most recent available evidence, in an article by J. Boelaert and co-authors, is that: 1) current LLMs fail to accurately predict human responses, 2) they do so in ways that are unpredictable, as they do not systematically favor specific social groups, and 3) their answers exhibit a substantially lower variance between subpopulations than what is found in real-world human data. In passing, this is evidence that so-called ‘bias’ does not necessarily operate as expected – LLM errors do not stem primarily from unbalanced training data.
These applications face specific ethical challenges. First, studies that require humans to interact with AI may expose them to offensive or inaccurate information, the so-called ‘AI hallucinations’. Second, there are new concerns about privacy and confidentiality. Most GenAI models are the private property of companies: if we use them to code in-depth interviews about a sensitive topic, the full content of these interviews may be shared with these companies, often not bound by the same standards and regulations in terms of personal data protection. Third, the environmental impact of these models is high, in terms of energy to run the system, water to cool servers in data centres, metal extraction to build devices, and production of e-waste. The literature on AI-as-object also warns that there is a cost in terms of the unprotected human work of annotators.
Another limitation is that is that research with Generative AI is difficult to replicate. These models are probabilistic in nature: even identical prompts may produce different outputs, in ways that are not well understood as of today. Also, models are constantly being fine-tuned by their producers in ways that we as users do not control. Finally, different LLMs have been found to produce substantially different results in some cases. Many of these issues are due to the proprietary nature of most models – so much so that some authors like C. Bail believe that open-source models devoted to, and controlled by, researchers can help address some of these challenges.
Overall, AI has slowly entered the toolbox of the sociologist, and except for some applications that are now commonplace (from automated transcriptions to NLP), its use has not completely revolutionised practices. This pattern is not exclusive to sociology. My own study of the diffusion of AI in science until 2021, as part of the ScientIA project led by F. Gargiulo, showed limited penetration in almost all disciplines, although the last two years have seen a major acceleration. The opportunities that AI offers are promising, although a lot are more hypothetical than real at the moment. We still see calls that invite sociologists and social scientists to embrace AI, but the number of realizations is still small. Almost all applications devote time to consider the epistemological, methodological, and substantive implications. A question that often emerges concerns the nature of bias. The AI-as-object perspective challenges the language of bias, and we see the same here, though from a different perspective. There’s still no shared definition of bias (or any substitute for this term). More generally, patterns are similar in qualitative and quantitative studies. The guest-editors of last year’s special issue of Sociologicasuggest that, like digital methods 10-15 years ago, generative AI is supporting a move beyond the traditional qualitative/quantitative divide.
Concluding, both Sociology-of-AI and Sociology-with-AI exist and are important, but they are not well integrated. This is one of the bottlenecks for the development of the methodological toolbox of sociology, but also for the development of an AI that is useful and positive for people and societies. In part, this may be due to lack of adequate (technical) training for part of the profession, or to the absence of guidelines (for ethics and/or scientific integrity). But perhaps, the real obstacles are less immediately visible. One of them is the difficulty to judge the uptake of AI in our discipline: are we just feeding the hype if we use it? Or are we missing a major opportunity to make sociology more relevant/stronger if we don’t? The other concerns the questions and issues that go beyond the specificities of sociology. How to continue interacting with other disciplines, while upholding the distinctive contribution of sociology?
I am pleased to co-organize with Vincent Lorant of UCLouvain a special session on “The visualization of personal networks” at the forthcoming INSNA Sunbelt conference (12-16 July 2022, Cairns, Australia, and online).
Personal network data collection methods allow describing the composition and the structure of an individual’s (hereafter ego) social network. This method has been implemented in different domains such as migration, drug use, mental health, aging, education, and social welfare. Over the last years, these data have also been used to provide respondents with visualizations of their personal network, using different algorithms and customizing results through computer assisted data collection. Visualization gives valuable feedback to the respondent, improves data validity and may trigger positive behavioural changes, notably in vulnerable individuals or groups. Yet, visualization is not a free lunch. Recent research has evidenced the ethical dilemmas of providing such feedback to individuals: ego’s social life is being exposed, the researcher may be exposed as well, and such feedback may imply some contractual exchanges or therapeutic implications that require attention.
This session aims to describe the stakes of different visualization approaches to personal networks with different populations. We welcome qualitative and quantitative papers addressing issues related to the implementation of visualization or reports of personal networks in terms of techniques, levels of respondent’s satisfaction with visualization, conditions under which visualization is recommended or discouraged, and effects of the personal network visualization for the respondent.
More information on the conference and the submission process is available here.
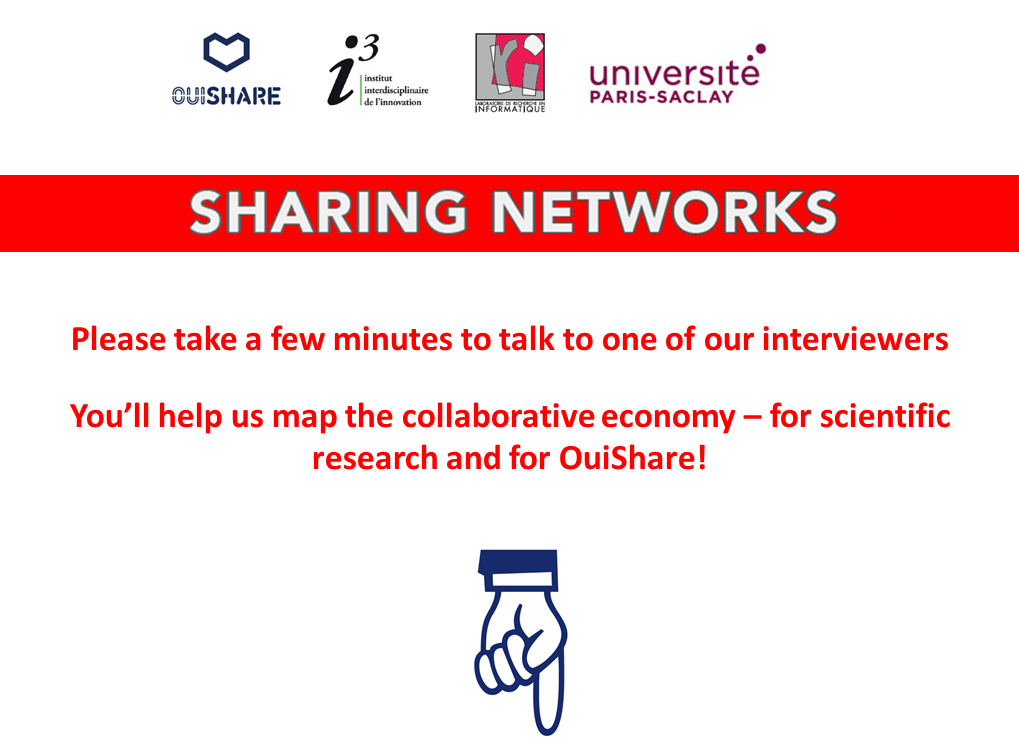
I’m excited to report that earlier this month, I ran the second wave of data collection for our Sharing Networks research project at OuiShare Fest 2017!
Publicizing the survey at OuiShare Fest 2017
To understand how people form and reinforce face-to-face network ties at such an event, I fielded a questionnaire with the help of a committed and effective team of co-researchers. It is a “name generator” asking respondents to name those they knew before the OuiShare Fest, and met again there (“old frields”); and those they met during the event for the first time (“new contacts”). Participants then have to choose those among their “old” and “new” contacts, that they would like to contact again in future for joint projects or collaborations.
Interestingly, my good old pen-and-paper questionnaire still gives a lot of insight that digital data from social media cannot provide – just like a highly computer literate community such as this feels the need to meet physically in one place every year for a few days. Like trade fairs that flourish even more in the internet era, the OuiShare Fest gathers more participants at each edition. They meet in person there, which is why they are to be invited to respond in person too.
I’m so excited that earlier this month, I ran the second wave of data collection for my Sharing Networks research project at OuiShare Fest 2017!
The study aims to map the collaborative economy community that gathers at OuiShare Fest, looking at how people network and how this fosters the emergence of new trends and topics.
During the event, a small team of committed and effective co-researchers helped me interview participants. We used a questionnaire with a “name generator” format, typically used in social network analysis to elicit people’s connections and reconstitute their social environment.
Specifically, we asked respondents to name people they knew before the
Results of our Sharing Networks 2016 survey have now become a T-shirt.
OuiShare Fest, and met again there (“old friends”), and people they met during the Fest for the first time (“new contacts”). Then we asked them to choose, from among the “old” and “new” they had named, those they would like to contact again with soon, for example for joint projects or collaborations.
I am very happy with the result: 160 completed interviews over three half-days! But it is still not enough: participants to the Fest were much more numerous than that, and in social network analysis, it is well-known that sampling is insufficient, and one needs to get as close to exhaustiveness as possible.
Therefore, for those OuiShare Fest 2017 participants that we did not manage to interview, there is now an opportunity to complete the questionnaire online.
If you were at the Fest and we did not talk to you, please do participate now! It takes less than 8 minutes, and you will help the research team as well as the organization of the Fest.
Many thanks to the team of co-researchers who helped me, the OuiShare team members who supported us, and all respondents.
More information about the Sharing Networks study is available here.
Highlights from results of last years’ Sharing Networks survey are available here.
The OuiShare Fest brings together representatives of the international collaborative economy community. One of its goals is to expose participants to inspiring new ideas, while also offering them an opportunity for networking and building collaborative ties.
At the 2016 OuiShare Fest, we ran a study of people’s networking. Attendees, speakers and team members were asked to complete a brief questionnaire, on paper or online.Through this questionnaire, we gained information on the relationships of 445 persons – about one-third of participants.
Ties that separate: the inheritance of past relationships
For many participants, the Fest was an opportunity to catch up with others they knew before. Of these relations, half are 12 months old at most. About 40% of them were formed at work; 15% at previous OuiShare Fests or other collaborative economy experiences; 9% can be ascribed to living in the same town or neighborhood; and 7% date back to school time.
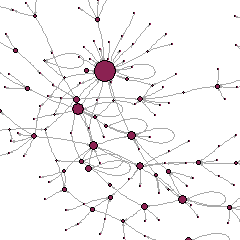
Figure 1: pre-existing ties
Figure 1 is a synthesis of these “catching-up-with-old-friends” relationships, in the shape of a network where small black dots represent people and blue lines represent social ties between them. At the center of the graph are “isolates”, participants who had no pre-existing relationship among OuiShare Fest attendees. The remaining 60% have prior connections, but form part of separate clusters. Some of them (27%) form a rather large component, visible at the top of the figure, where each member is directly or indirectly connected to anyone else in that component. There are also two medium-sized clusters of connected people at the bottom. The rest consists of many tiny sub-groups, mostly of 2-3 individuals each.
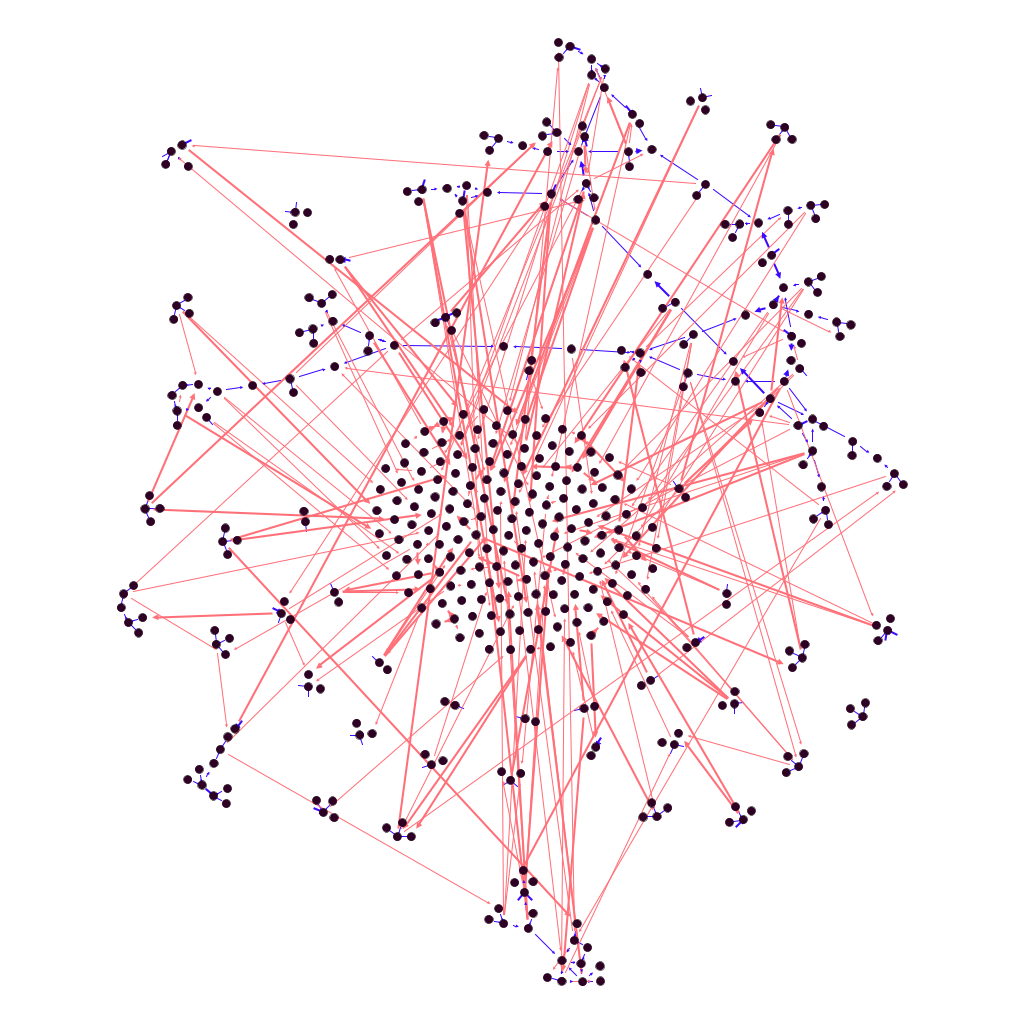
Ties that bind: new acquaintances made at the event
Participants told us that they also met new persons at the Fest. Figure 2 enriches Figure 1 by adding – in red – the new connections that people made during the event. The ties formed during the Fest connect the clusters that were separate before: now, 86% of participants are in the largest network component, meaning that any one of them can reach, directly or indirectly, 86% of the others.
Each speaker briefly presented a case study that involved visualization, and all were great in conveying exciting albeit complex ideas in a short time span. What follows is a short summary of the main insight (as I saw it).
Antonio A. Casilli and I carried out a study during the OuiShare Fest 2016, a major international get-together of the collaborative economy community that took place in Paris on 18-21 May 2016.
Our goal is to look at how people network at this important event and how their meetings, their talking to each other and their informal interactions help shape the community — so as to foster the emergence of new ideas, trends and topics.
If you were a participant, speaker, journalist organizer or team member/volunteer, you were asked to complete a brief questionnaire in paper format that was handed out to you upon arrival at the Fest.
If you didn’t manage to fill in the questionnaire onsite, there is still time to do so online. It takes only about 8 minutes to do so and your contribution will help scientific research as well as the organization of the Fest.
Results will be made available through the OuiShare Magazine and other online outlets.
A new, master’s level programme of study in Survey and Data Science is to be offered jointly by the University of Mannheim, the University of Maryland, the University of Michigan, and Westat. Applications for the first delivery are accepted until 3 January, for a start in Spring 2016. Prospective students are professionals with a first degree, at least one year of work experience, and some background in statistics or applied mathematics. All courses are delivered in English, fully online, to small classes (it’s not a MOOC!). Tuition is free, thank to support from German public funds at least for the first few cohorts.
What is most interesting about this master is its twofold core, involving both more classical survey methodology and today’s trendy data science. Fundamental changes in the nature of data, their availability, the way in which they are collected, integrated, and disseminated, have found many professionals unprepared. These changes are partly due to “big” data from the internet and digital devices becoming increasingly predominant relative to “small” data from surveys. Big data offer the benefit of fast, low-cost access to an unprecedented wealth of informational resources, but also bring challenges as these are “found” rather than “designed” data: less structured, less representative, less well documented (if at all…). In part, these changes are also due to the world of surveys changing internally, with new technical challenges (regarding for example data preservation, in a world of pre-programmed digital obsolescence), legislative issues (such as those triggered by greater awareness of privacy protection), increased demand by multiple users, and a growing need to merge surveys and data from other (such as business and administrative) sources. It is therefore necessary, as the promoters of this new study programme rightly recognize, to prepare students for the challenges of working both with designed data from surveys and with big data.
It will be interesting to see how data science, statistics, and social science / survey methodology feed into each other and support each other (or fail to do so…). There is still work to be done to develop techniques for analyzing data that allow us to gain insights more thoroughly, not just more quickly, and help us develop solid theories, rather than just uncovering new relationships that might eventually turn out to be spurious.
In the age of big data, social surveys haven’t lost their appeal and interest. Surveys are the instrument through which governments, for a long time, have gathered information on their population and economy to inform their choices. Interestingly, surveys conducted by, or for, governments are the best in terms of quality and coverage: because significant resources are invested in their design and realization, and especially because participation can be made compulsory by law (they are “official”), their sampling strategies are excellent and their response rates are extremely high. (Indeed, official government surveys are practically the only case in which the “random sampling” principles taught in theoretical statistics courses are actually applied). In short, these are the best “small data” available — and their qualities make them superior to many a (usually messy) big data collection. It is for this reason that surveys from official statistics have always been in high demand by social researchers.