 This morning, we had a plenary on “Visualisation and social networks in mixed-methods sociological research” at the British Sociological Association conference now going on in Manchester. This session, organized by the BSA study group on social networks that I convene with Alessio D’Angelo (BSA SNAG), builds on a special section of Sociological Research Online that we edited in 2016. Alessio and I chaired and had four top-flying speakers: Nick Crossley, Gemma Edwards (both at the University of Manchester), Bernie Hogan (Oxford Internet Institute) and Louise Ryan (University of Sheffield).
Each speaker briefly presented a case study that involved visualization, and all were great in conveying exciting albeit complex ideas in a short time span. What follows is a short summary of the main insight (as I saw it).
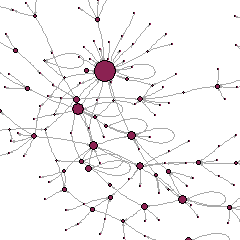
Nick used social network analysis and visualization to study the emergence of punk in 1970s London. Networks are 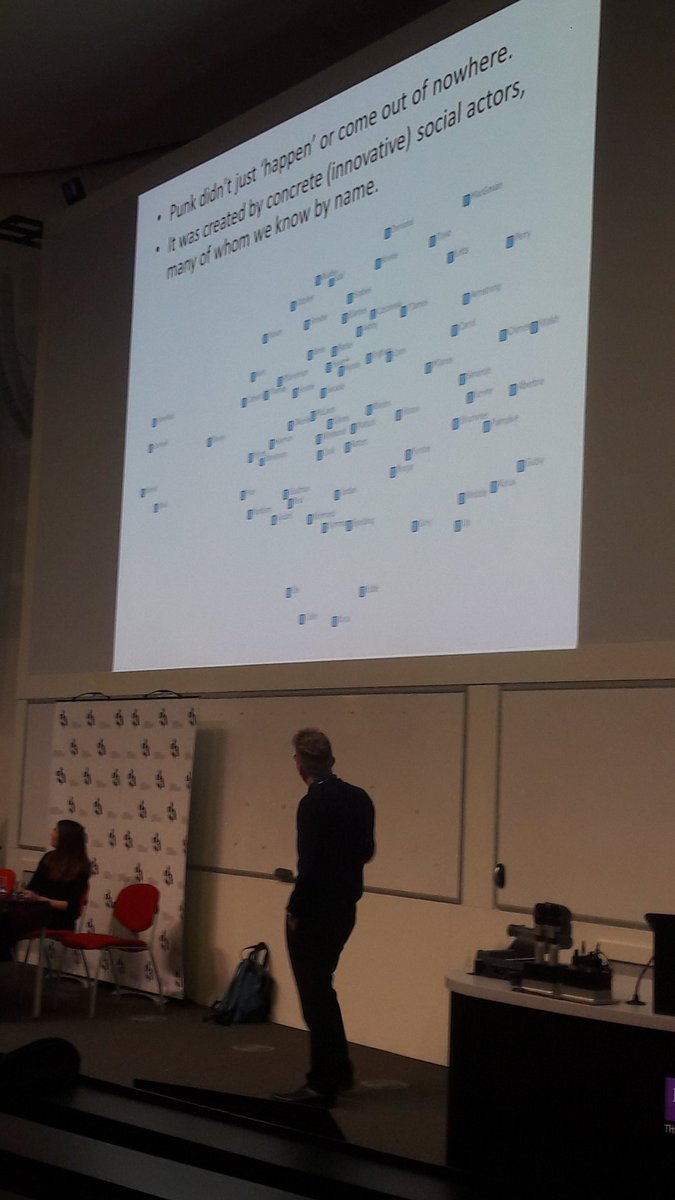 defined on the basis of collaboration ties, not just acquaintances; because collaborations often involved several people, networks look like cliques connected through “bridging” individuals. Many people were isolates at the beginning, but got connected over time – in parallel to the movement gaining visibility. This clearly distinguishes London from places like Manchester – with a similar socio-economic-political context but a much sparser network and persistently high numbers of isolates. That’s why it was not in Manchester that punk flourished….
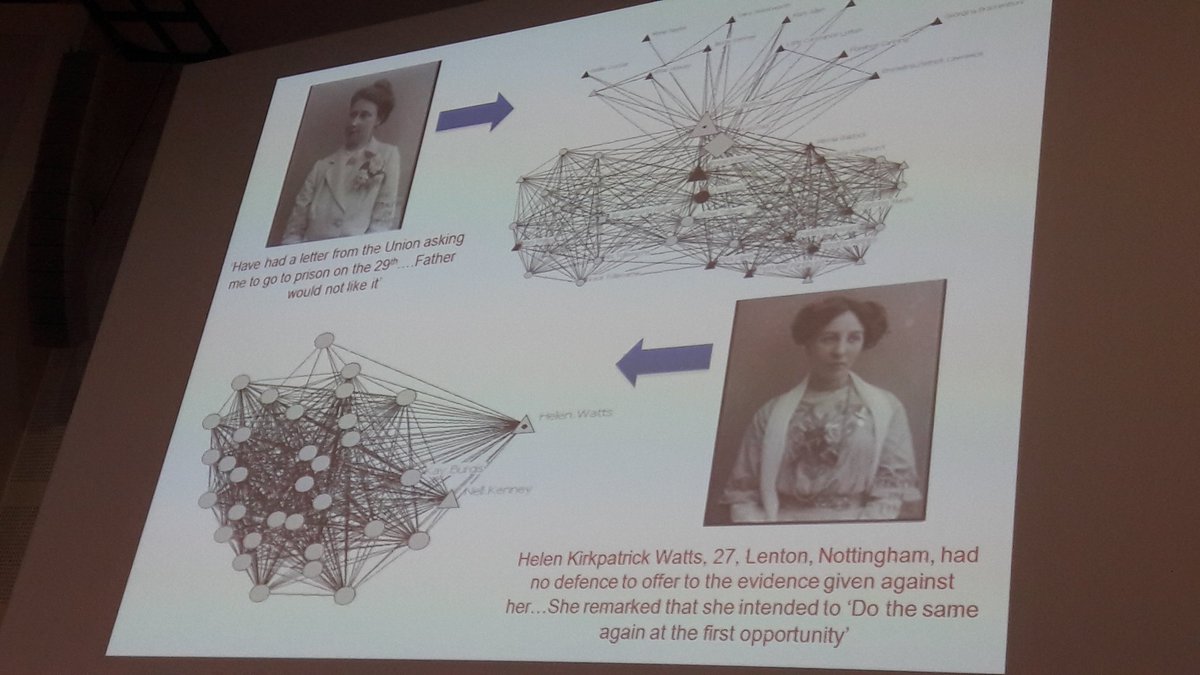 Gemma used social network visualizations to synthesize relational information she found in the archives (diaries and letters) of early twentieth-century suffragettes. One letter informs about a single relationship and the persons involved; the networked structure derived from the letters represents a whole relational environment. Structure and composition of a network should be interpreted jointly, and results are sometimes counter-intuitive: a suffragette who knew more activists, but was part of a larger, more diverse network was less likely to engage in violent protest than a suffragette with fewer connections to the movement, but more limited exposure to alternative views.
Bernie presented his fascinating project NetCanvas, to develop digital tools to collect personal network data. A  pioneer in the use of (paper-based) participant-drawn sociograms in interviews (also an inspiration for me!) Bernie is now leveraging on this insight and experience to do the computer-based equivalent. Personal networks elicited in this way are meaningful for study participants and give them a sense of control on what information is being collected about them. This is very different from just downloading someone’s network from social media such as Facebook – where results are algorithmically determined and the data subject remains passive throughout.
 Louise discussed ongitudinal research on social networks using qualitative or mixed methods. These are mostly follow up studies, not necessarily planned in advance. Like Bernie, she also used participant-drawn sociograms (on paper) and it was interesting to note she considers them as “visual narratives” that support the interview process and represent the interviewee’s view of their relationships, rather than an exogenously determined structure. They help to, for example, review commonly held ideas about the networks of migrants – more complex than many would believe. Louise has just published (with A. D’Angelo) an open-access article in Social Networks on this.
Different types of visuals were shown: points-and-lines diagrams (usually organized according to some force algorithm, eg Nick’s punk groups and Gemma’s network of suffragettes) and concentric-circles schemes (usually organized according to some importance principle, eg Bernie’s and Louise’s sociograms). Some of these were “whole” networks (Nick’s punk scene in London), others were “personal” networks (Gemma’s Helen Watts and her network).
The Q&A part of the session was also quite interesting, with discussions around the definition of ties, the role of space and time, the extent to which networks convey social capital.
A very interesting session overall – thanks to all speakers and participants!
All pictures by A. D’Angelo.
