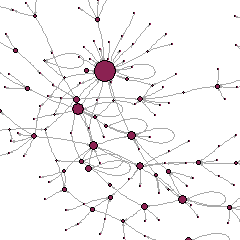
The five papers in this peer-reviewed special issue explore the potential of visual tools to accompany qualitative and mixed-methods research. Visualization can support data collection, analysis and presentation of results; it can be used for personal or complete networks; it can be paper-and-pencil or computer-based. Overall, visualization helps to jointly understand network contents and network structures.
The special issue is freely accessible from all commercial (non-academic) internet providers.
Visualization in Mixed-Methods Research on Social Networks (Introduction to the special section),
by Alessio D’Angelo, Louise Ryan and Paola Tubaro
Cases, Mechanisms and the Real: The Theory and Methodology of Mixed-Method Social Network Analysis,
by Nick Crossley and Gemma Edwards
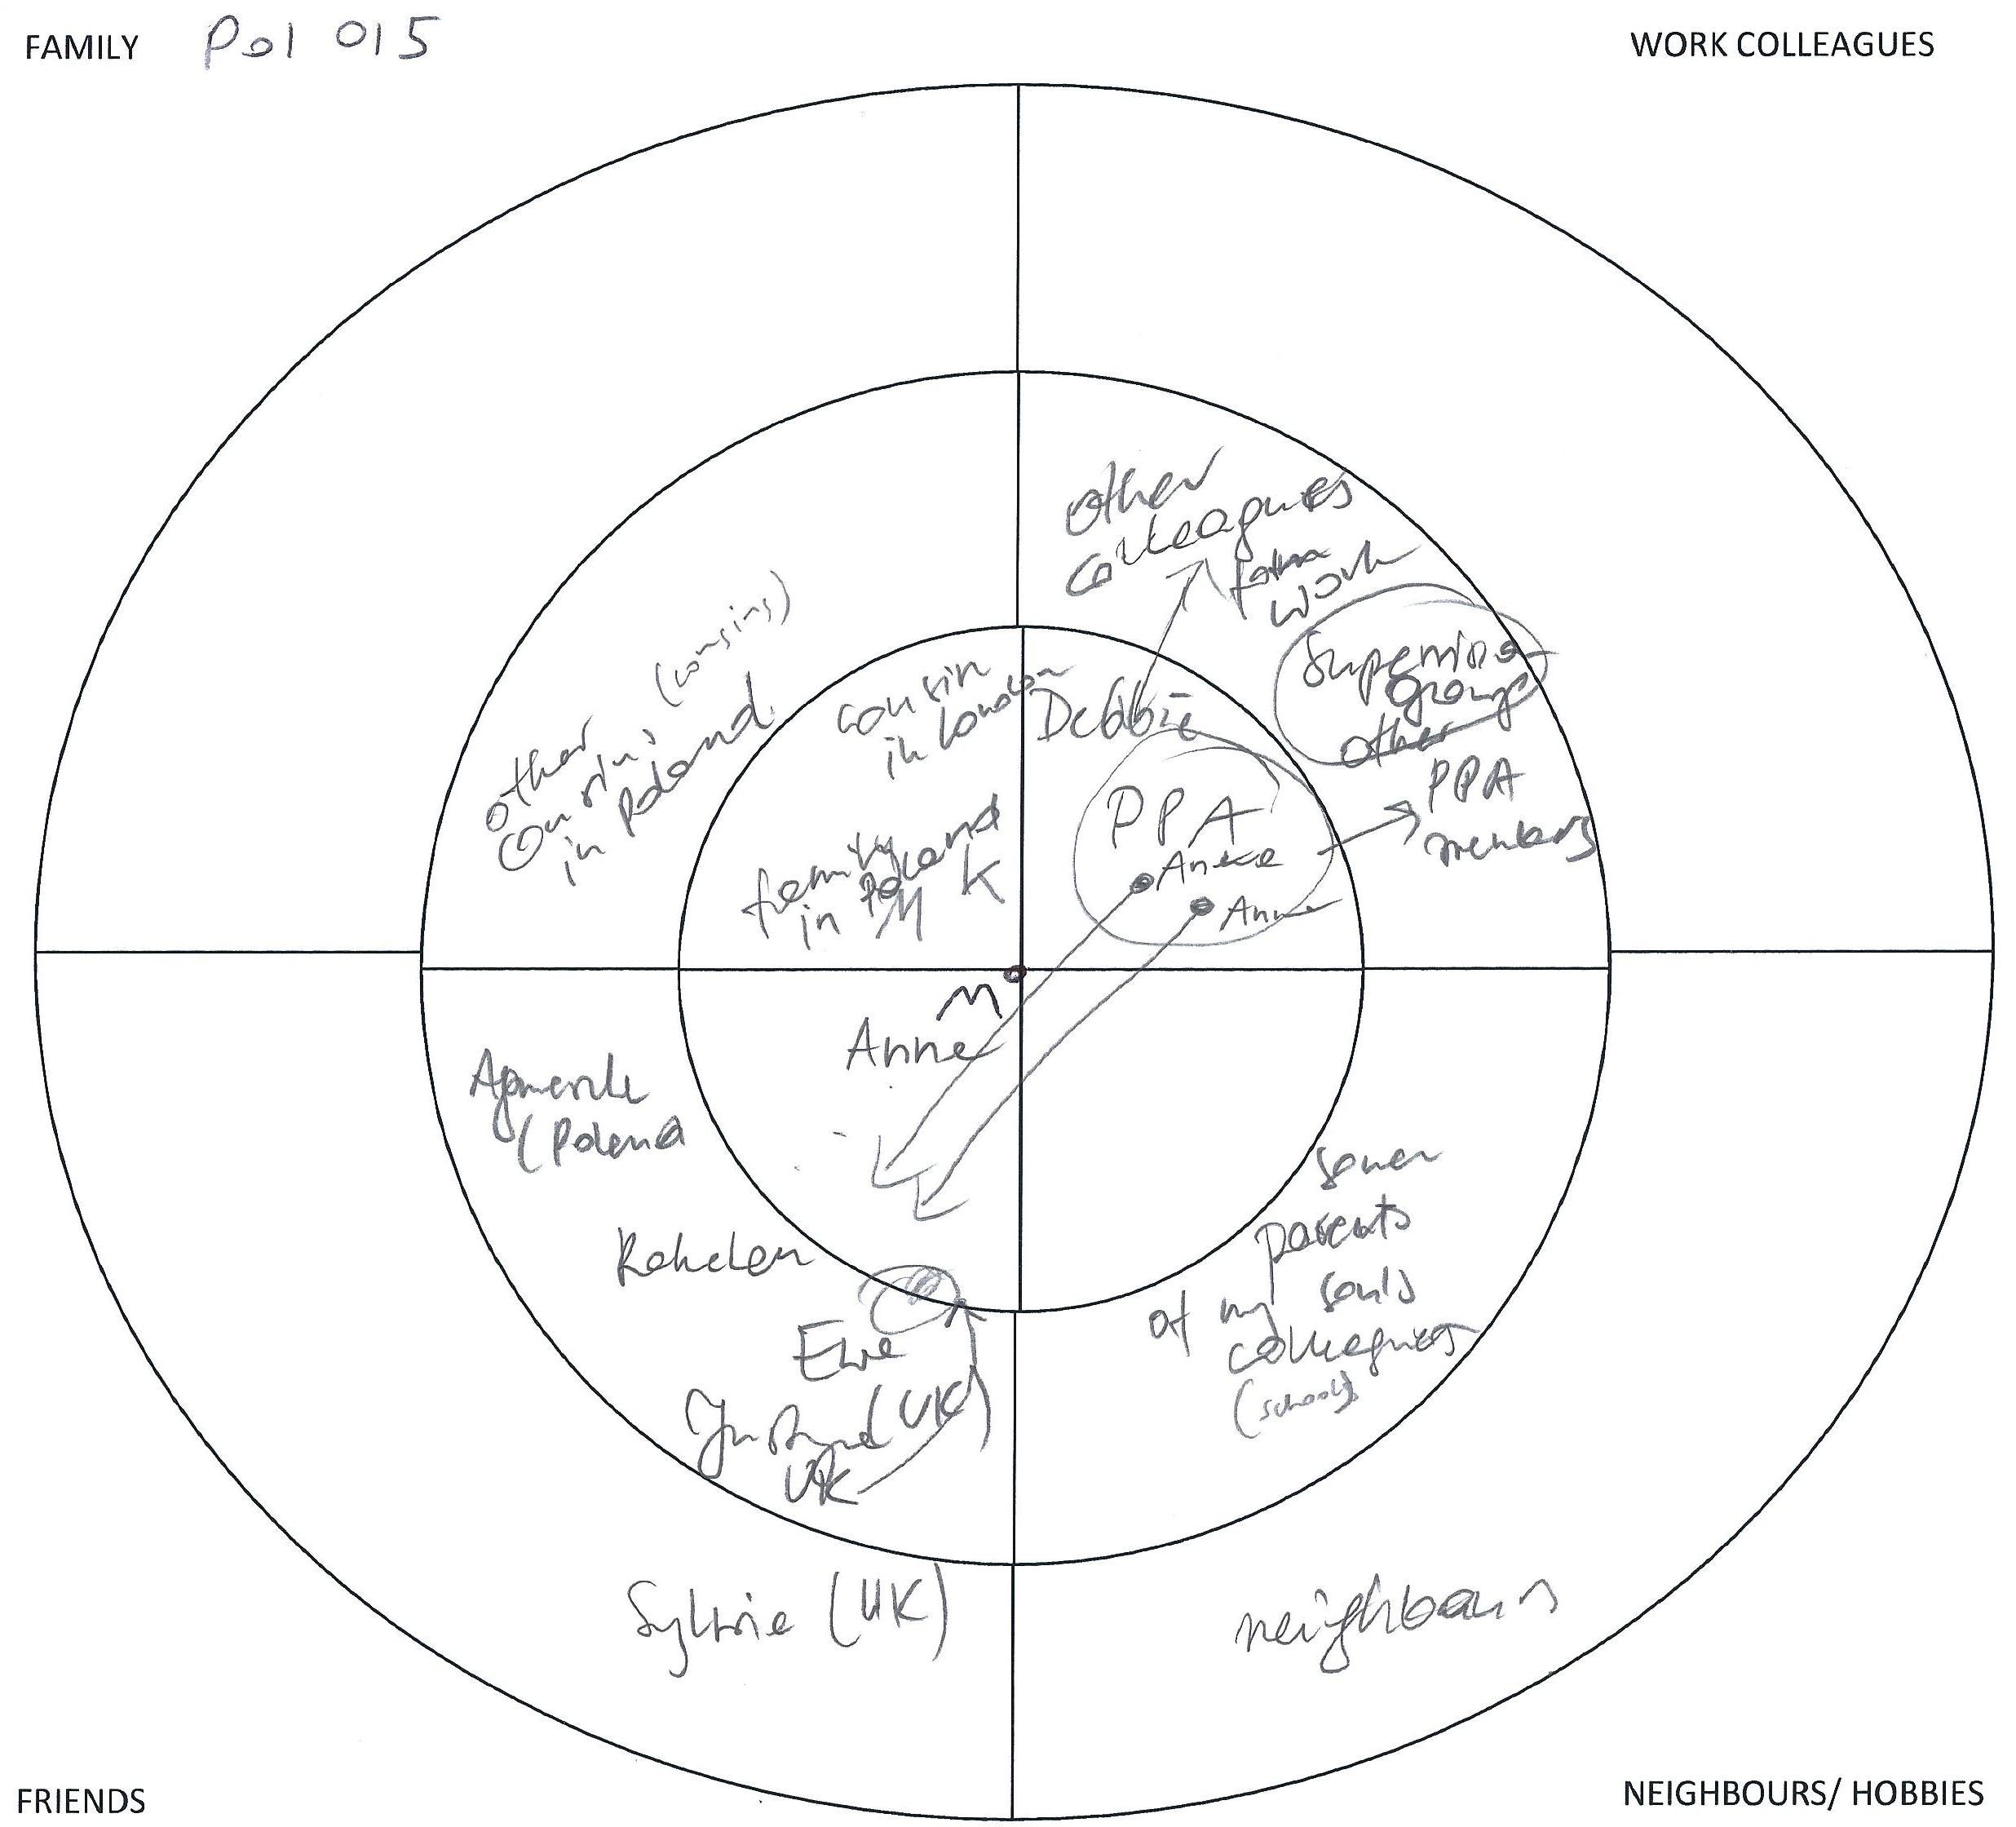
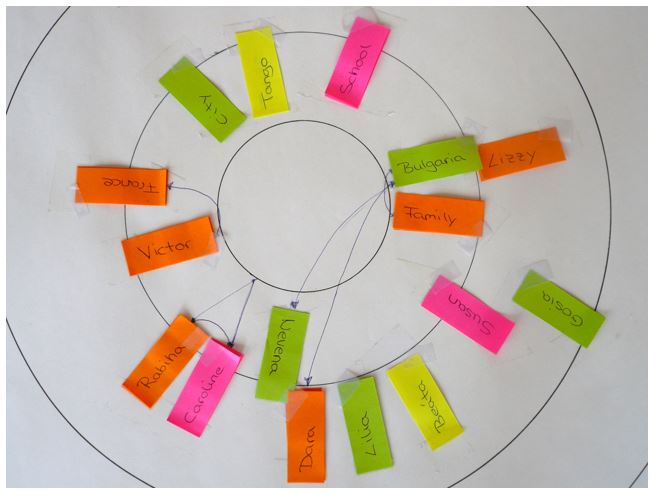
The Visual Sociogram in Qualitative and Mixed-Methods Research,
by Paola Tubaro, Louise Ryan and Alessio D’Angelo
Qualitative Methods and Visualizations in the Study of Friendship Networks,
by Elisa Bellotti
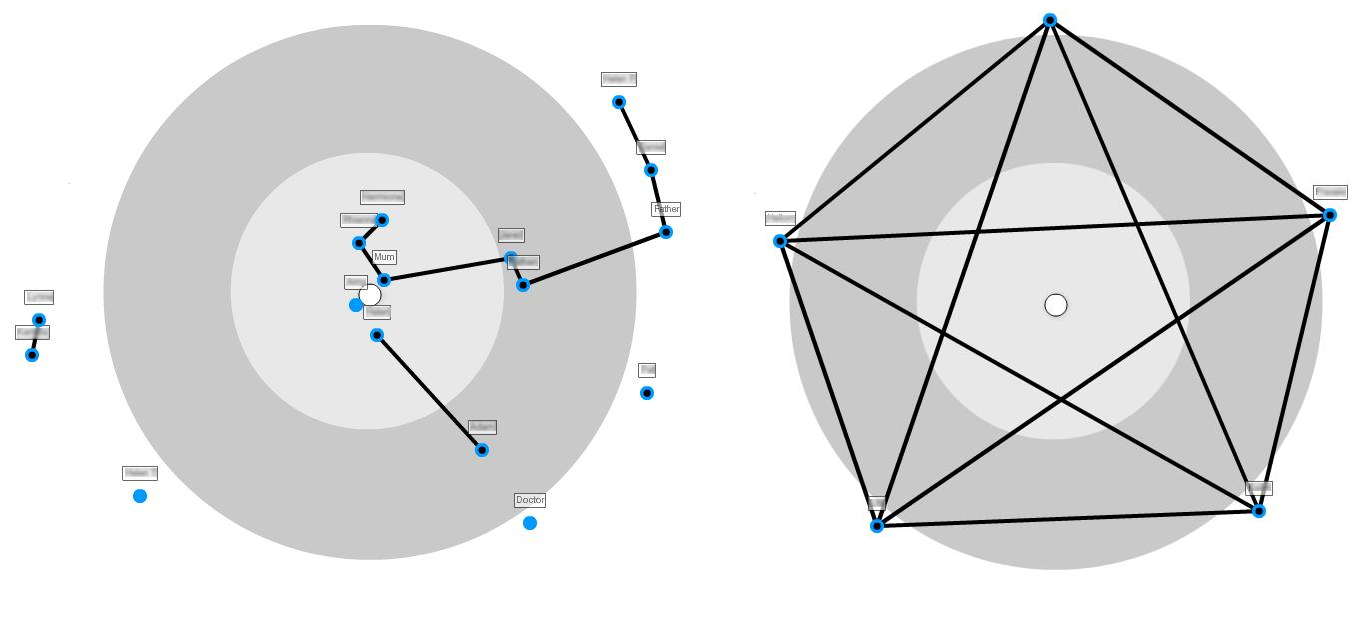
Combining Egocentric Network Maps and Narratives: An Applied Analysis of Qualitative Network Map Interviews,
by Alice Altissimo
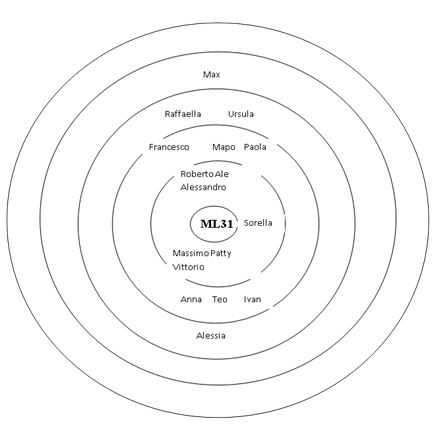
The Biographical Network Method,
by Neil Armitage
