Data and theory: substitutes or complements? Lessons from history of economics

EE
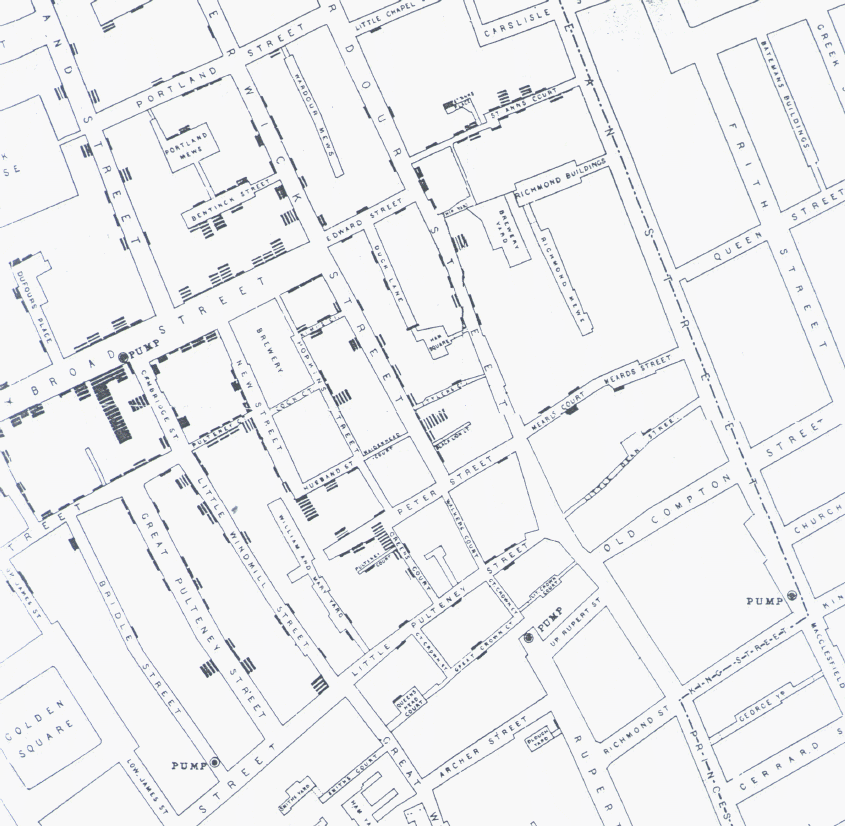
Today, my chapter on “Formalization and mathematical modelling” is published in a new series of three reference books on History of Economic Analysis (edited by G. Faccarello and H. Kurz, Edward Elgar). The chapter draws heavily on key ideas I developed as part of my thesis on the origins of mathematical economics. But this was a long time ago and reading it again today, I see it in a different light. I notice in particular that economics developed its distinctive mathematical flavour, which makes it neatly stand out relative to the other social sciences, at times in which social research was data-poor – and it did so not despite data paucity, but precisely because of it. William S. Jevons, a 19th-century forefather of the discipline who was clearly aware of the relevance of maths, wrote in 1871:

“The data are almost wholly deficient for the complete solution of any one problem”

yet:

“we have mathematical theory without the data requisite for precise calculation”

Continue reading “Data and theory: substitutes or complements? Lessons from history of economics”

Big data and history

archive_pic
A paper archive – more and more often replaced by digitised versions today.

Yesterday at Biblithèque Nationale de France, I took part in a panel discussion  on longue durée in history, organised by the Revue Annales – Histoire et Sciences Sociales. Of course I am not a historian, and I wouldn’t be able to tell whether one interpretation of longue durée is better than another. But historians are now raising questions that are common to the social sciences and humanities more generally: how to benefit from big data and how to re-think the political engagement of the researcher. So I was there to talk about big data and how they change not just research practices and methods, but also researchers’ position relative to power, politics, and industry. This questions cross disciplinary boundaries, and all may benefit from dialogue.

BellinghamCB001
Collection of older sources is now often online and enables application of new methods.

What ignited the historians’ debate was an attempt by two leading scholars, David Armitage and Jo Guldi, to restore history’s place as a critical social science, based on (among other things) increased availability of large amounts of historical data and the digital tools necessary to analyze them. Before their article in Annales, they published a full book in open access, the History Manifesto, where they develop their argument in more detail. Their writing is deliberately provocative, and indeed triggered strong (and sometimes very negative) reactions. Yet the sheer fact that so many people took the trouble to reply, proves that they stroke a chord.

What do they say about big data? They highlight the opportunity of accessing large and rich archives and to expand research beyond any previous limitations. Their enthusiasm may seem excessive but it is entirely understandable insofar as their goal is to shake up their colleagues. My approach was to take their suggestion seriously and ask: what opportunities and challenges do data bring about? How would they affect research, especially for historians?

Continue reading “Big data and history”

The power of dataviz (150 years ago)

Science, like the rest of human life, is subject to fashions. Data visualisation is the latest trend: policy-makers and the public are all under its charm, and researchers magically suspend their disbelief — give me a fancy image, and I won’t look too closely at your p-values. So I was intrigued by the discovery, at a talk few days ago by Paul Jackson of the Office for National Statistics, that there are precedents, and that they have a long history behind them.

The story is that of John Snow, an epidemiologist who was persuaded, against the received wisdom of the mid-nineteenth century,  that cholera does not propagate through air but through contaminated water or food. But how to convince others? When cholera struck London in 1854, Snow began plotting the location of deaths on a map of Soho: he represented each death through a line parallel to the building front in which the person died.

snow_cholera_map

Snow soon realised that there was a concentration of “death lines” around Broad Street — more specifically, around a water pump at the corner between Broad and Cambridge St.

snow_cholera_map_detail

He managed to convince the authorities to remove the handle of the pump, so that people could no longer use it: in a few days, the number of deaths in the area plummeted. Snow had proven his point and saved lives: using no medical trials, no sophisticated chemistry, just with some basic count statistics, and a clever dataviz.