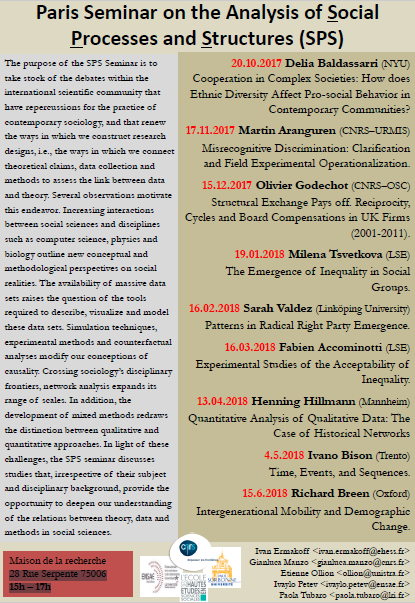
Networks in the collaborative economy: social ties at the OuiShare Fest 2016

The OuiShare Fest brings together representatives of the international collaborative economy community. One of its goals is to expose participants to inspiring new ideas, while also offering them an opportunity for networking and building collaborative ties.

At the 2016 OuiShare Fest, we ran a study of people’s networking. Attendees, speakers and team members were asked to complete a brief questionnaire, on paper or online.Through this questionnaire, we gained information on the relationships of 445 persons – about one-third of participants.

Ties that separate: the inheritance of past relationships

For many participants, the Fest was an opportunity to catch up with others they knew before. Of these relations, half are 12 months old at most. About 40% of them were formed at work; 15% at previous OuiShare Fests or other collaborative economy experiences; 9% can be ascribed to living in the same town or neighborhood; and 7% date back to school time.

Figure 1: pre-existing ties

Figure 1 is a synthesis of these “catching-up-with-old-friends” relationships, in the shape of a network where small black dots represent people and blue lines represent social ties between them. At the center of the graph are “isolates”, participants who had no pre-existing relationship among OuiShare Fest attendees. The remaining 60% have prior connections, but form part of separate clusters. Some of them (27%) form a rather large component, visible at the top of the figure, where each member is directly or indirectly connected to anyone else in that component. There are also two medium-sized clusters of connected people at the bottom. The rest consists of many tiny sub-groups, mostly of 2-3 individuals each.

Ties that bind: new acquaintances made at the event

Participants told us that they also met new persons at the Fest. Figure 2 enriches Figure 1 by adding – in red – the new connections that people made during the event. The ties formed during the Fest connect the clusters that were separate before: now, 86% of participants are in the largest network component, meaning that any one of them can reach, directly or indirectly, 86% of the others.

Figure 2: new ties created at the event

Continue reading “Networks in the collaborative economy: social ties at the OuiShare Fest 2016”

Open Data: What’s new in 2017?

I am now in Montréal, where I participated, last Friday, in a panel on Open Data at “Science & You” international conference. It was interesting for me to reflect on how the picture has changed since my previous panel on the same topic – in Kiev in 2012. Back then, we were busy trying to convince public administrations that data opening was good for transparency and could help improve services to communities. Since then, a lot of attempts have been made in numerous countries – local authorities often pioneering the process, followed only later by central governments (one example cited in my panel was Québec City). What is made open is typically information from public registers (first names of newborns, records of road accidents) and increasingly, from technological devices and sensors (bus traffic information).

There are some conditions to be met for a dataset to be said “open”:

  • Technically, it needs to be “raw”, detailed, digital and reusable. The French Interior Ministry released results of the first round of the recent presidential elections within a few days, at polling station level. This is sufficiently detailed (with over 69,000 polling stations throughout the country), raw (allowing aggregations, comparisons etc.), and digital/reusable (so much so that the newspaper Le Monde could develop a user-friendly application to let readers easily check results in their neighborhoods). Some would also insist that “open” data should be released in non-proprietary formats (better .csv than .xls, for example).
  • Legally, the data must come with a license that allows re-use by third parties (typically within the Creative Commons family). Ideally, no type of reuse should be ruled out (including somewhat controversially, commercial / for-profit reuse).
  • Economically, the data should be available to all for free (or at least with minimal charges if data preparation requires extra work or expenses).

If in the past few years, a lot of thought has been devoted to the “ideal” conditions for data opening and how this would positively affect public service, the data landscape has now significantly changed.

Continue reading “Open Data: What’s new in 2017?”

Visualisation, mixed methods and social networks: what’s new

This morning, we had a plenary on “Visualisation and social networks in mixed-methods sociological research” at the British Sociological Association conference now going on in Manchester. This session, organized by the BSA study group on social networks that I convene with Alessio D’Angelo (BSA SNAG), builds on a special section of Sociological Research Online that we edited in 2016. Alessio and I chaired and had four top-flying speakers: Nick Crossley, Gemma Edwards (both at the University of Manchester), Bernie Hogan (Oxford Internet Institute) and Louise Ryan (University of Sheffield).

Each speaker briefly presented a case study that involved visualization, and all were great in conveying exciting albeit complex ideas in a short time span. What follows is a short summary of the main insight (as I saw it).

Continue reading “Visualisation, mixed methods and social networks: what’s new”

Science XXL: digital data and social science

I attended last week (unfortunately only part of) an interesting workshop on the effects of today’s abundance and diversity of digital data on social science practices, aptly called “Science XXL“. A variety of topics were discussed and different research experiences were shared, but I’ll just summarize here a few lessons learned that I find interesting.

  • Digital data are archive data. Data retrieved automatically from the digital traces of individual actions, such as those mined from the APIs of platforms such as Twitter, are unlike survey data in that they were not originally recorded for research purposes. The researcher must select relevant records on the basis of some understanding of the conditions under which these data were produced. Perhaps ironically, digital data share these characteristic with data from historical or literary archives.
  • Digital data are not necessarily “big”, in the sense that their volume is often small (at least in social science research so far!), even though they may share other characteristics of big data such as velocity (being generated on the fly as people use digital platforms) or variety (being little or not structured).
  • Digital data can help fill gaps in survey data, for example when survey sampling is not statistically representative: detail and volume can provide extra information that supports general conclusions.
  • Non-clean data, outliers and aberrant observations may be very informative, revealing details that would escape attention if researchers focused only on the average or center of the distribution (the normal law cherished in classical statistical approaches). Special cases are no longer a prerogative of qualitative research.
  • Data analysis is a key ingredient of “computational social science” a field that is growing in importance after an initial phase in which it was largely confined to agent-based simulation and complexity theory.

A cooperative approach to platforms

I was yesterday at a nice and interesting conference in Brussels on “How to coop the collaborative economy“, organized by major actors of the Belgian cooperative movement and building on the experience of a growing network of persons and organizations to enhance a cooperative view of the internet. Several themes in connection with my studies of the collaborative economy emerged, and I’d like to summarize here what were, in my view, the main lessons learned of the day.

Continue reading “A cooperative approach to platforms”

New: Paris Seminar on the Analysis of Social Processes and Structures (SPS)

Together with colleagues Gianluca Manzo, Etienne Ollion, Ivan Ermakoff, and Ivaylo Petev, I organize a new inter-institutional seminar series in sociology.

This new Social Processes and Structures (SPS) Seminar aims to take stock of the debates within the international scientific community that have repercussions for the practice of contemporary sociology, and that renew the ways in which we construct research designs, i.e., the ways in which we connect theoretical claims, data collection and methods to assess the link between data and theory. Several observations motivate this endeavor. Increasing interactions between social sciences and disciplines such as computer science, physics and biology outline new conceptual and methodological perspectives on social realities. The availability of massive data sets raises the question of the tools required to describe, visualize and model these data sets. Simulation techniques, experimental methods and counterfactual analyses modify our conceptions of causality. Crossing sociology’s disciplinary frontiers, network analysis expands its range of scales. In addition, the development of mixed methods redraws the distinction between qualitative and quantitative approaches. In light of these challenges, the SPS seminar discusses studies that, no matter their subject and disciplinary background, provide the opportunity to deepen our understanding of the relations between theory, data and methods in social sciences.

The inaugural session took place on 20 November 2016; the “regular” series starts this Friday, 27 January, and will continue until June, with one meeting per month.

All sessions take place at Maison de la Recherche, 28 rue Serpente, 75006 Paris, room D040, 5pm-7pm. All interested students and scholars are welcome, and there is no need to register in advance.

Continue reading “New: Paris Seminar on the Analysis of Social Processes and Structures (SPS)”

Big data, big money: how companies thrive on informational resources

Information oils the economy – as we know since the path-breaking research of George Akerlof, Michael Spence and Joseph Stiglitz in the 1970s – and information can be extracted from data. Today, increased availability of “big” data creates the opportunity to access ever more information – for the good of the economy, then.

But in practice, how do companies extract value from this increasingly available information? In a nutshell, there are three ways in which they can do so: matching, targeted advertising, and market segmentation.

Matching is the key business idea of many recently-created companies and start-ups, and consists in helping potential parties to a transaction to find each other: driver and passenger (Uber), host and guest (Airbnb), buyer and seller (eBay), and so on. It is by processing users’ data with suitable algorithms that matching can be done, and the more detailed are the data, the more satisfactory the matching. Firms’ business model is usually based on taking a fee for each successful transaction (each realized match).

Targeted advertising is the practice of selecting, for each user, only the ads that correspond at best to their tastes or practices. Publicizing diapers to the general population will be largely ineffective as many people do not have young children; but targeting only those with young children is likely to produce better results. Here, the function of data is to help decide what to advertise to whom; useful data are people’s socio-demographic situation (age, marriage, children…), their current or past practices (if you bought diapers last week, you might do that again next week), and any declared tastes (for example as a post on Facebook or Twitter). How this produces a gain is obvious: if targeted adverts are more effective, sales will go up.

Continue reading “Big data, big money: how companies thrive on informational resources”

Special RFS issue on Big Data

Revue Française de Sociologie invites article proposals for a special issue on “Big Data, Societies and Social Sciences”, edited by Gilles Bastin (PACTE, Sciences Po Grenoble) and myself.

Focus is on two inextricably interwoven questions: how do big data transform society? How do big data affect social science practices?

Substantive as well as epistemological / methodological contributions are welcome. We are particularly interested in proposals that examine the social effects and/or the scientific implications of big data based on first-hand experience in the field.

The deadline for submission of extended abstracts is 28 February 2017; for full contributions, it is 15 September 2017. Revue Française de Sociologie accepts articles in French or English.

Further details and guidelines for submission are in the call for papers.

Data, health online communities and the collaborative economy: my tour of Québec

This November gave me the opportunity to give talks and participate in scientific events throughout Québec.

comsanteI started in Montréal, with a seminar at ComSanté, the health communication research centre of Université du Québec à Montréal (UQAM), where I presented my recently published book on websites on eating disorders. While most media attention focused on controversial “pro-anorexia” contents, presented as an undesirable effect of online free speech, I made the point that this part of the webosphere is rather to be seen as a symptom of the effects of current transformations of healthcare systems under austerity policies. Cuts in public health spending encourage patients to be active, informed and equipped, but the resulting social pressure creates paradoxical behaviors and risk-taking.

Also in Montréal, I was invited to a discussion with economic journalist Diane Bérard on the growth and crisis of theecocoll collaborative economy. About 50 people attended the event, co-organised by co-working space L’Esplanade, OuiShare Montréal and the journal Les Affaires. Diane summarized the essentials of the event in a blog post just the day after, and noted six main points:

  • The Uber case dominates discussions and divides the audience – though the collaborative economy is not (just) Uber.
  • The discussion gets easily polarized – a result of the tension between commercial and non-commercial goals of the collaborative economy.
  • We still know little of the business models of these platforms and the external factors that facilitate or hinder their success.
  • Sharing is in fact a niche market – now probably declining after the first enthusiasms.
  • The key issue for the future is work – its transformations, and how it is re-organizing itself.
  • Collaborative principles advance even outside the world of digital platforms, and sometimes permeate more traditional sectors. The near future of collaboration are sharing cities.

Continue reading “Data, health online communities and the collaborative economy: my tour of Québec”

Twitter networks at the OuiShare Fest Barcelona 2016

Twitter conversations are one way through which participants in an event engage with the programme, comment and discuss about the talks they attend, prolong questions-and-answers sessions. Twitter feeds have become part of the official communication strategy of major events and serve documentation and information purposes, both for attendees and for outsiders. While tweeting is becoming more an more a prerogative of “official” accounts in charge of event communication, it is also a potential tool in the hands of each participant, allowing anyone to join the conversation at least in principe. Earlier, I have discussed how the Twitter discussion networks formed at the OuiShare Fest 2016, a major gathering of the collaborative economy community that took place last May in Paris, were one opportunity to see such mechanisms in place.

Here is a similar analysis, performed after the OuiShareFest Barcelona – the Spanish-language version of the event that I had the chance of attending last week. The size of this event is smaller than its Paris counterpart but nonetheless impressive: I mined 3497 tweets with the official hashtag of the event, #OSfestBCN, mostly written during the two days of the event (my count stopped the day after). Do Twitter #OSfestBCN conversations describe the community?

First, when did people tweet? As often happens, there are more tweets on the first than the second day of the event, and there are more tweets during the first hours of each day, though the difference between morning and afternoon is not dramatic; tweeting declines only at night, when the fest’s activities are suspended. Online activity is not independent of what happens on the ground – quite on the contrary, it follows the timings of physical activity.

osfestbcn_tweetsovertime_days12_plum

Who tweeted most? Obviously the official @OuiShare_es account, who published 630 tweets – nine times as many as the second in the ranking. Those who follow immediately are all individuals, who have between 50-70 tweets each.

Who tweeted with whom? What interests me most are conversations – who interacts with whom. The most explicit way of seeing this with Twitter data is to look at replies: who replied to whom. This corresponds to a small social network of 134 tweeters (the coloured points in the next Figure). Ties among them are represented as lines in the figure, and the size of points depends on the number of their incoming ties, that is, the number of replies received. Beyond the official @OuiShare_es account, several tweeters receive a lot of replies:  they are mostly speakers, track leaders, or otherwise important actors in the community.

replies

Now, who tweeted about whom? This is also an important aspect of Twitter conversations. We can capture it with the social network of mentions, associating each tweeter with those they mentioned, and counting the number of times they did so. This will be a larger network (with 2553 mentions) compared to the net of replies, as mentions can be of many types and also include retweets.

The below figure represents the network of mentions. As before, the colored points are tweeters (the larger they, the more often they have been mentioned by others), while lines between them are mentions (the thicker they are, the higher the number of times a user has mentioned another). Colors represent a measure called “modularity”, which identifies clusters of nodes whereby internal connections are stronger than the connections they have with nodes in other clusters; so for example, a purple node is more likely to have mentioned other purple nodes, than blue nodes.

Modularity is computed based only on counts of ties, without considering the nature of their conversations (what the mention is about) ou other qualities of nodes (gender, nationality, language of tweeters, etc.). And yet, it clearly identifies specific sub-communities. The very numerous, central purple nodes are the OuiShare community: connectors, activists, and others close to the organization especially within Spain. The green nodes at the bottom-left are the catalan community, including representatives of local authorities,notably the Barcelona municipality. The blue nodes at the bottom are different actors and groups from other parts of Spain. The few black nodes on the left are the international OuiShare community, and the sparse orange ones at the top are other international actors.

mentions22

This analysis is part of a larger research project, “Sharing Networks“, led by Antonio A. Casilli and myself, and dedicated to the study of the emergence of communities of values and interest at the OuiShare Fest 2016. Twitter networks will be combined with other data on networking – including informal networking which we are capturing through a (perhaps old-fashioned, but still useful!) survey.

The analyses and visualizations above were done with the package TwitteR in R as well as Gephi.