I attended last week (unfortunately only part of) an interesting workshop on the effects of today’s abundance and diversity of digital data on social science practices, aptly called “Science XXL“. A variety of topics were discussed and different research experiences were shared, but I’ll just summarize here a few lessons learned that I find interesting.
Digital data are archive data. Data retrieved automatically from the digital traces of individual actions, such as those mined from the APIs of platforms such as Twitter, are unlike survey data in that they were not originally recorded for research purposes. The researcher must select relevant records on the basis of some understanding of the conditions under which these data were produced. Perhaps ironically, digital data share these characteristic with data from historical or literary archives.
Digital data are not necessarily “big”, in the sense that their volume is often small (at least in social science research so far!), even though they may share other characteristics of big data such as velocity (being generated on the fly as people use digital platforms) or variety (being little or not structured).
Digital data can help fill gaps in survey data, for example when survey sampling is not statistically representative: detail and volume can provide extra information that supports general conclusions.
Non-clean data, outliers and aberrant observations may be very informative, revealing details that would escape attention if researchers focused only on the average or center of the distribution (the normal law cherished in classical statistical approaches). Special cases are no longer a prerogative of qualitative research.
Data analysis is a key ingredient of “computational social science” a field that is growing in importance after an initial phase in which it was largely confined to agent-based simulation and complexity theory.
Twitter conversations are one way through which participants in an event engage with the programme, comment and discuss about the talks they attend, prolong questions-and-answers sessions. Twitter feeds have become part of the official communication strategy of major events and serve documentation and information purposes, both for attendees and for outsiders. While tweeting is becoming more an more a prerogative of “official” accounts in charge of event communication, it is also a potential tool in the hands of each participant, allowing anyone to join the conversation at least in principe. Earlier, I have discussed how the Twitter discussion networks formed at the OuiShare Fest 2016, a major gathering of the collaborative economy community that took place last May in Paris, were one opportunity to see such mechanisms in place.
Here is a similar analysis, performed after the OuiShareFest Barcelona – the Spanish-language version of the event that I had the chance of attending last week. The size of this event is smaller than its Paris counterpart but nonetheless impressive: I mined 3497 tweets with the official hashtag of the event, #OSfestBCN, mostly written during the two days of the event (my count stopped the day after). Do Twitter #OSfestBCN conversations describe the community?
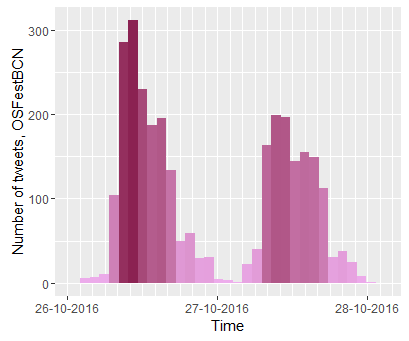
First, when did people tweet? As often happens, there are more tweets on the first than the second day of the event, and there are more tweets during the first hours of each day, though the difference between morning and afternoon is not dramatic; tweeting declines only at night, when the fest’s activities are suspended. Online activity is not independent of what happens on the ground – quite on the contrary, it follows the timings of physical activity.
Who tweeted most? Obviously the official @OuiShare_es account, who published 630 tweets – nine times as many as the second in the ranking. Those who follow immediately are all individuals, who have between 50-70 tweets each.
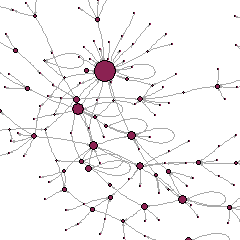
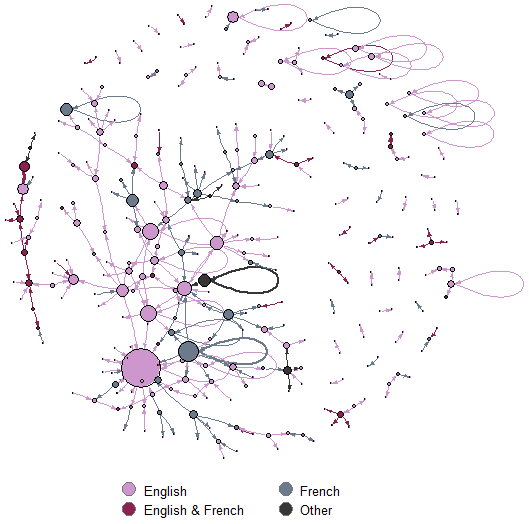
Who tweeted with whom? What interests me most are conversations – who interacts with whom. The most explicit way of seeing this with Twitter data is to look at replies: who replied to whom. This corresponds to a small social network of 134 tweeters (the coloured points in the next Figure). Ties among them are represented as lines in the figure, and the size of points depends on the number of their incoming ties, that is, the number of replies received. Beyond the official @OuiShare_es account, several tweeters receive a lot of replies: they are mostly speakers, track leaders, or otherwise important actors in the community.
Now, who tweeted about whom? This is also an important aspect of Twitter conversations. We can capture it with the social network of mentions, associating each tweeter with those they mentioned, and counting the number of times they did so. This will be a larger network (with 2553 mentions) compared to the net of replies, as mentions can be of many types and also include retweets.
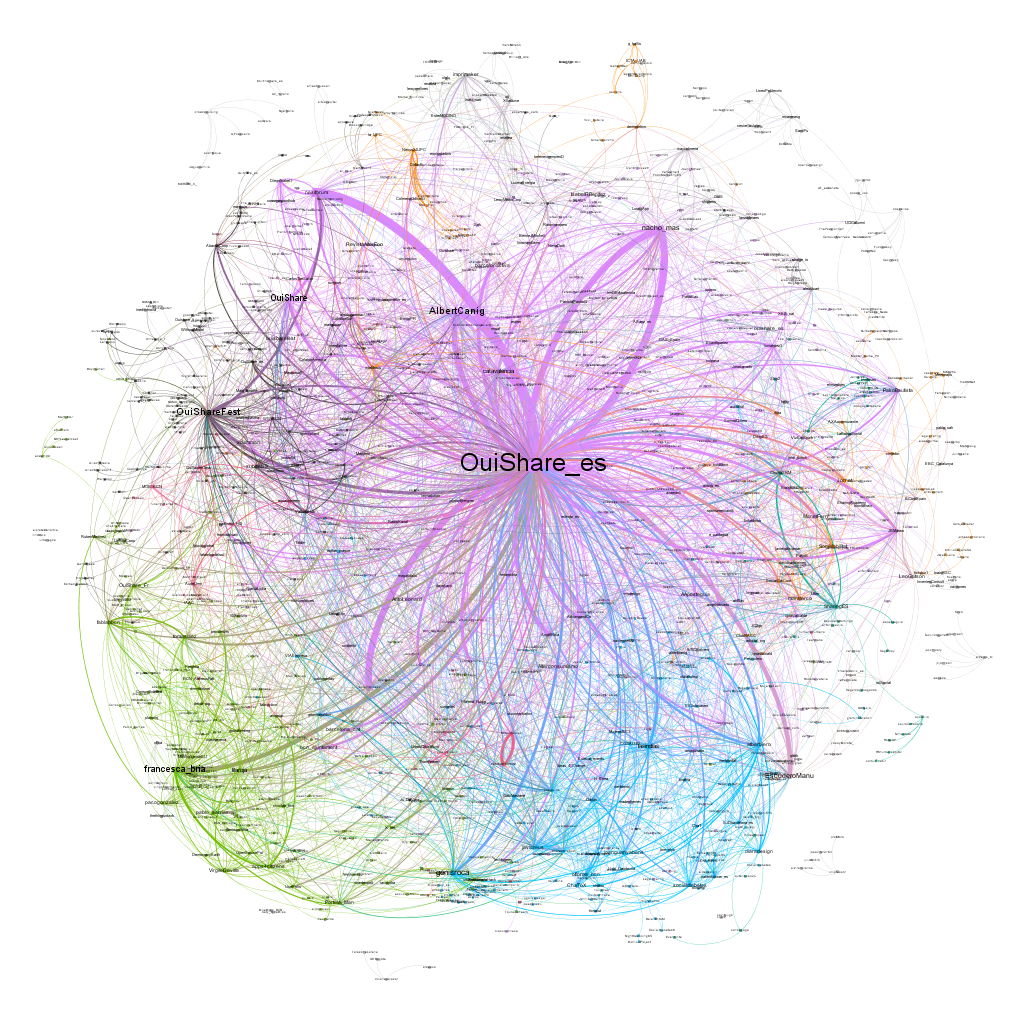
The below figure represents the network of mentions. As before, the colored points are tweeters (the larger they, the more often they have been mentioned by others), while lines between them are mentions (the thicker they are, the higher the number of times a user has mentioned another). Colors represent a measure called “modularity”, which identifies clusters of nodes whereby internal connections are stronger than the connections they have with nodes in other clusters; so for example, a purple node is more likely to have mentioned other purple nodes, than blue nodes.
Modularity is computed based only on counts of ties, without considering the nature of their conversations (what the mention is about) ou other qualities of nodes (gender, nationality, language of tweeters, etc.). And yet, it clearly identifies specific sub-communities. The very numerous, central purple nodes are the OuiShare community: connectors, activists, and others close to the organization especially within Spain. The green nodes at the bottom-left are the catalan community, including representatives of local authorities,notably the Barcelona municipality. The blue nodes at the bottom are different actors and groups from other parts of Spain. The few black nodes on the left are the international OuiShare community, and the sparse orange ones at the top are other international actors.
This analysis is part of a larger research project, “Sharing Networks“, led by Antonio A. Casilli and myself, and dedicated to the study of the emergence of communities of values and interest at the OuiShare Fest 2016. Twitter networks will be combined with other data on networking – including informal networking which we are capturing through a (perhaps old-fashioned, but still useful!) survey.
The analyses and visualizations above were done with the package TwitteR in R as well as Gephi.
Twitter conversations are one way through which participants in an event engage with the programme, comment and discuss about the talks they attend, prolong questions-and-answers sessions. Twitter feeds have become part of the official communication strategy of major events and serve documentation and information purposes, both for attendees and for outsiders. While tweeting is becoming more an more a prerogative of “official” accounts in charge of event communication, it is also a potential tool in the hands of each participant, allowing anyone to join the conversation at least in principe. Participants may become aware of each other, perhaps using the opportunity of the event to meet face-to-face, start relationships and even collaborations. A Nesta study insisted on the potential for using social media data to attain a quantitative understanding of events and their impacts on participants’ networks.
The OuiShare Fest 2016, a major gathering of the collaborative economy community that took place last week in Paris, was one opportunity to see such mechanisms in place. Tweeting was easy – with an official hashtag, #OSFEST16, although related hashtags were also widely used. I mined a total of 12440 tweets over the four days of the event. Do Twitter conversations related to the Fest bring to light the emergence of a community? While it’s too early for any deep analysis, some descriptive results can already be shown.
First, when did people tweet? Mostly at the beginning of each day’s programme (9am on the first two days, 2pm on the third day). Tweeting was more intense in the first day and declined over time (Figure 1). The comparatively low participation on the fourth day is due to the fact that the format was different – an open day in French (rather than an international conference in English), whereby local people were free to come and go. Online activity is not independent of what happens on the ground – quite on the contrary, it follows the timings of physical activity.
Figure 1: Tweets over time.
Who tweeted most? Our dataset has a predictable outlier, the official @OuiShareFest Twitter account, who published 727 tweets – twice as many as the second in the ranking. But let’s look at the people who had no obligation to tweet, and still did so: who among them contributed most to documenting the Fest? Figure 2 shows the presence of some other institutional accounts among the top 10, but the most active include a few individual participants. Ironically, one of them was not even physically present at the Fest, and followed the live video streaming from home. In this sense, Twitter served as an interface between event participants and interested people who couldn’t make it to Paris.
Figure 2: Ten most active tweeters (excluding @OuiShareFest).
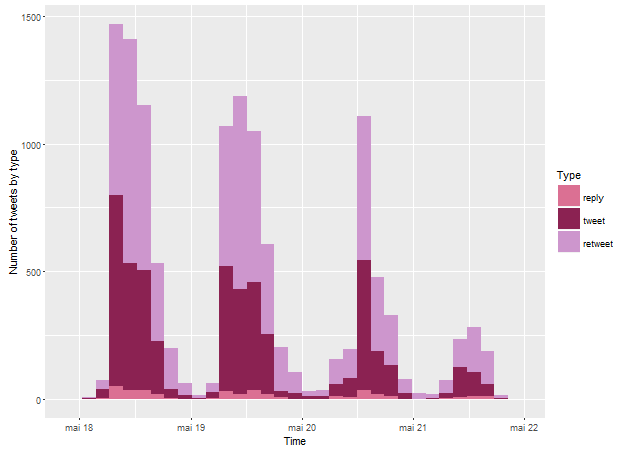
What was the proportion of tweets, replies and retweets? Original tweets are interesting for their unique content (what are people talking about?), while replies and retweets are interesting because they reveal social interactions – dialogue, endorsement or criticism between users. Figure 3 shows that the number of replies is small compared to tweets and retweets.
Figure 3: Tweets, replies and retweets
Let’s now look closer at the replies. By taking who replied to whom, we can build a social network of conversations between a group of tweeters. It’s a relatively small network of 311 tweeters (the coloured points in Figure 4), with 321 ties among them (the lines in Figure 4). The size of points depends on the number of their incoming ties, that is, the number of replies received: even if the points haven’t been labelled, I am sure you can tell immediately which one represents the official @OuiShareFest account… the usual suspect! But let’s look at the network structure more closely. Some ties are self-loops, that is, people replying to themselves. (Let’s be clear, it’s not a sign of social isolation, but simply a consequence of the 140-character limit imposed on Twitter: self-replies are meant to deliver longer messages). A lot of other participants are involved in just simple dyads or small chains (A replies to B who replies to C, but then C does not reply to A), unconnected to the rest. There is a larger cluster formed around the most replied-to users: here, some closure becomes apparent (A replies to B who replies to C who replies to A) and enables this sub-network to grow.
Figure 4: the network of replies.
Now, my own experience of tweeting at the Fest suggested that tweets were multilingual. Apart from the fourth day, there seemed to be a large number of French-speaking participants. A quick-and-dirty (for now) language detection exercise revealed that roughly 60% of tweets were in English, 25% in French, the rest being split between different languages especially German, Spanish, and Catalan. So, did people reply to each other based on the language of their tweets? It turns out that quite a few tweeters were involved in conversations in multiple languages. Figure 5 is a variant of Figure 4, colouring nodes and ties differently depending on language. A nice mix: interestingly, the central cluster is not monolingual and in fact, is kept together by a few, albeit small, multi-lingual tweeters.
Figure 5: the network of replies, by language.
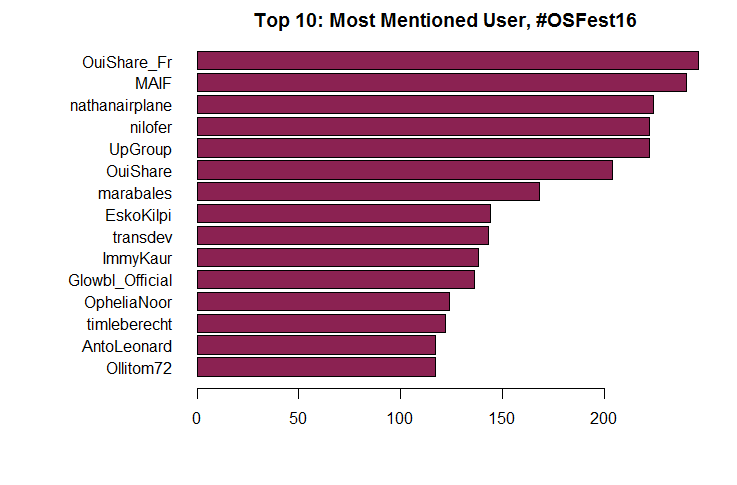
Let’s turn now to mentions: who are the most mentioned tweeters? Again, I’ll take out of the analysis @OuiShareFest, hugely ahead of anyone else with 832 mentions received. Below, Figure 6 ranks the most mentioned: mostly companies (partners or sponsors of the event such as MAIF), speakers (such as Nathan Schneider, Nilofer Merchant), and key OuiShare personalities (such as Antonin Léonard). Mentions follow the programme of the event, and most mentioned are people and organizations that play a role in shaping it.
Figure 6: Most mentioned tweeters.
Mentions are also a basis to build another social network – of who mentions whom in a tweet. This will be a larger network compared to the net of replies, as mentions can be of many types and also include retweets (which as we saw above, are very numerous here). There are 17248 mentions (some of which are repeated more than once) in the network. They involve 796 users who mention others and are mentioned in turn; 550 users who are mentioned, but do not mention themselves; and 1680 users who mention others, but are not themselves mentioned.
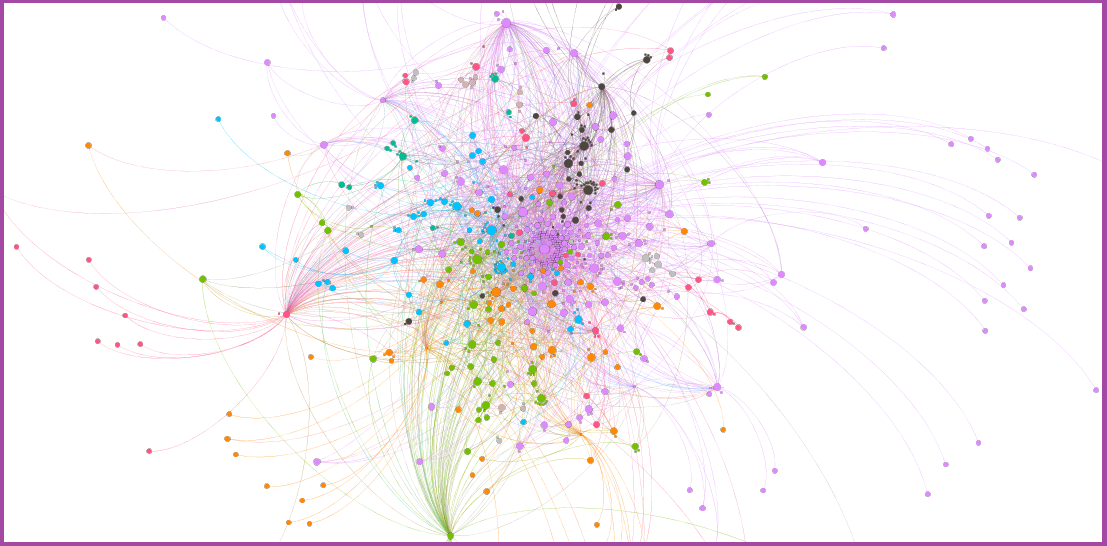
A large network such as this is more difficult to visualize meaningfully, and I had to introduce some simplifications to do so. I have included only pairs in which one had mentioned the other at least twice: this makes a network of 778 nodes with 2222 ties. The color of nodes depends on their modularity class (a group of nodes that are more connected with one another, than with any other nodes in the network) and their size depends on the number of mentions received. You will clearly recognize at the center of the network, the official @OuiShareFest account, which structures the bulk of the conversations. But even intuitively, other actors seem central as well, and their role deserves being examined more thoroghly (in some future, less preliminary analysis).
Figure 7: Network of Twitter mentions
This analysis is part of a larger research project, “Sharing Networks“, led by Antonio A. Casilli and myself, and dedicated to the study of the emergence of communities of values and interest at the OuiShare Fest 2016. Twitter networks will be combined with other data on networking – including informal networking which we are capturing through a (perhaps old-fashioned, but still useful!) survey.
The analyses and visualizations above were done with the packages TwitteR and igraph in R; Figure 7 was produced with Gephi.
Some time ago, I wrote a post on ethical issues in research with secondary data – a somewhat grey area, where students and scholars often feel guidance is insufficient. Even more complex is research with internet data – neither primary nor secondary strictly speaking, but “big” data. A recent case fuelled an international debate on how researchers should deal with data that are, apparently, accessible to all on the web: a Danish graduate student published a large dataset of users of the online dating site OkCupid (he apparently did so without any institutional backing, and Aarhus University where he studies, is now on the case). Michael Zimmer, a specialist of information studies and the policy and ethics of online research, properly summarizes the issues in a recent Wired article:
Don’t say that “the data are already public”. The fact that OkCupid users knowingly share some personal information, does not mean they consent to it being used for purposes other than interactions with other users on that site. By scrapping data, one may be able to put together the whole history of users’ presence on that platform, revealing more of their life or personality than they themselves are aware of. More dangerously, data extracted in this way might in some cases be matched with other information, thereby potentially becoming much more disclosive than what the persons concerned ever intended or agreed. And the disclosure may be aggravated by releasing the data outside the platform.
The rise of digital data, particularly data from the internet, is to be understood in social relational perspective. Online interactions – from email exchanges to use of VOIP services and participation in social media such as Facebook, Twitter and LinkedIn – make people’s social connections explicit and visible. The “social network”, once a metaphor used only in a small sub-field within sociology, is now familiar to everybody as the archetype of computer-mediated social interaction. Digital devices systematically record network structures, so that social ties become an essential part of every individual profile, and users are more and more aware of them.
One consequence of this is the booming popularity of network analysis concepts, which support the algorithms that handle digital data: for example, centrality measures are at the heart of search engine functionalities, and transitivity measures found “friend-of-a-friend” algorithms in social media. In passing, social network analysis itself which had been originally developed for small-sized, non-digital datasets (like surveys about friendship in schools) has undergone a major upgrade to account for social data from the web.
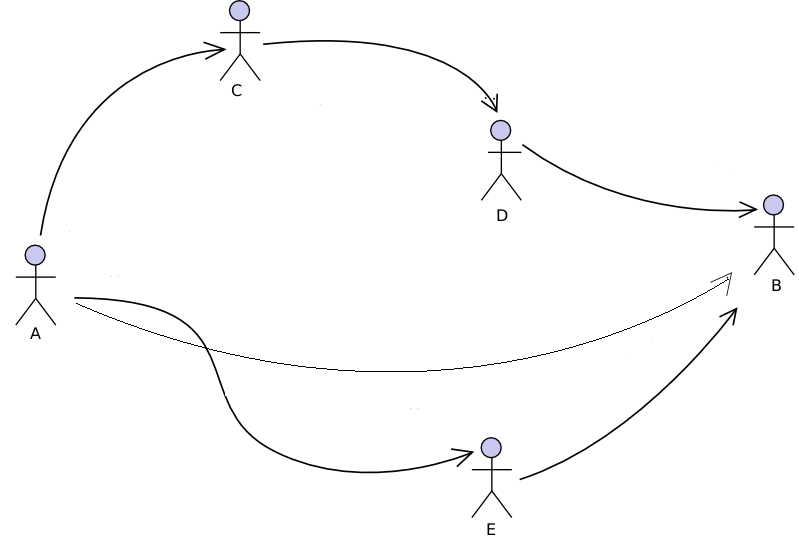
More importantly, the relational nature of digital data and the underlying possibilities to use social network analysis, open up new avenues for data collection. If user B publishes a post on, say, their Facebook wall, comments and “likes” received from their friends A, D and E will be connected to the profile of B, accessible and visible from it; in other words, it is possible to retrieve information on A, D or E through the profile of just B. In general social networks, a friend of my friend is my friend; in digital networks, the data of my friends are my data.
I gave a presentation on the topic of “Data and social networks: empowerment and new uncertainties” at the Better Decisions Forum on Big Data and Open Data that took place in Rome on 12 November 2014. The event brought together six speakers from different backgrounds on a variety of topics related to data, and participants were businesspeople, public administration managers, journalists, data and computer scientists.
Here is a video of my talk:
Unfortunately as you will have noticed, the slides are not always very clearly visible, so it’s better to download them from their original source:
My interview before my talk:
See? I am trying to stick to my 1st-January commitment of blogging more this year…
This article was first published on Discover Society, November 2014.
Last June, a group of Italian MPs proposed jail terms and fines for authors of so-called “pro-ana” (anorexia) and “pro-mia” (bulimia) websites. These are self-styled online communities on eating disorders which are viewed as promoting extreme dieting and unhealthy eating practices. France and the United Kingdom preceded Italy’s attempt to pass restrictive legislation as far back as 2008-9, and many internet service providers also endeavoured to ban these contents.
But the potential spread of health-hazardous behaviours is probably only one side of the coin, and these websites might also channel health-enhancing assistance, advice, and support (Yeshua-Katz & Martins 2013). In fact a closer look reveals that website users carefully manage their online socialisation to address their health challenges. Online social spaces enable discussion around the illness and constitute a complement, albeit an admittedly imperfect one, to formal healthcare services. There is no rejection of standard health norms in the name of some extreme ideal of thinness but rather a need – or perhaps, a cry – for extra support.
A social science approach brings out these results. The effect of web interactions on health does not only depend on website contents, but also on how people actually use them, share them, and access resources through them. The social, rather than just clinical dimension of eating disorders, recognized long before the advent of the web (Bell 1985, Orbach 1978), becomes ever more relevant in the current context and calls for a more comprehensive view of the “ana” and “mia” social universe.
Data visualisation is still relatively uncommon in the social sciences, and is not normally expected to be part of the standard work of a scholar (contrary, some would say, to what happens in the sciences, where visualisation is sometimes necessary to figure out the properties of objects whose existence is proven, but which cannot be seen). Yet data visualisation has an extraordinary history of accomplishments even in the social realm, as cleverly documented in a forthcoming article by James Moody and Kieran Healy; and classics such as Pierre Bourdieu valued it and attempted to use it in at least some of their work, as Baptiste Coulmont interestingly reported in a blog post.
Yet the digital age offers new opportunities for data visualisation, that are largely unexploited in the social sciences. It becomes not only a tool for the researcher — to explore data prior to conducting statistical analyses, or to present results once the work is done — but also for the general user, the study subject, the beneficiary of any policy under discussion, and the general public. As theorists in the arts and digital humanities (but not much in the social sciences, I am afraid) have noticed, the Internet and all digital infrastructures are becoming today interfaces with databases, and users of all types are immersed in a world of data in a way that was unknown before. This means that data visualisations can have new and more transformative uses, empowering study subjects and people in general, by offering them intuitive and aesthetically appealing tools to better navigate this digital world. But it also involves new dangers, as to who sets the agenda and what aspects or characteristics of the data are being stressed; data are not just objective, ‘raw’ materials but mediated ones, and the choice of how to make them perceptible by the senses is not neutral.
At the annual conference of the British Sociological Association today in Leeds, in the Methodological Innovations Stream, I am presenting data visualisation work I have done with colleagues Antonio A. Casilli, Lise Mounier and Fred Pailler, as well as data visuliaser Quentin Bréant, as part of the research project ANAMIA. We developed three tools — one for data collection, one for data exploration and preliminary analysis, one as a basis for heuristics and presentation of results. The first was for our study subjects, the second for us researchers and our colleagues, the third for us and the larger public. My slides are available:
A now classical result of the sociology of social networks is the distinction between formal social structures defined by kinship, inherited hierarchy or companies’ organisational charts, and informal structures arising from nets of friendship, trust, solidarity, similarities and dissimilarities. As far back as 1954, John A. Barnes (who incidentally, is credited with coining the wording ‘social networks’) in a renowned study of a small community of fishers in a Norwegian parish demonstrated that exogenously defined positions such as those arising from political administration, economic activity or family are insufficient to explain the social structure of the community, which largely depends on less codified relationships of friendship and acquaintance. In organisational studies, it appeared that the formal chart of a company and the actual networks of advice, trust or communication of members may differ widely, and surveys aimed at eliciting network ties (with ‘name generators’ for example) became a privileged means to bring to light the ‘company behind the chart‘ (Krackhardt & Hanson 1993) and to make ‘invisible work visible‘ (Cross, Parker & Borgatti 2002). Social network scholars advised managers on how, by using employee questionnaires, they could generate network maps and get to the root of many organisational problems. Another major finding was about the emergence of informal roles – the leader, the deviant, the broker – and their important contribution to driving the behaviours and outcomes of human groups, beyond all prescribed, formal authorities (Johnson, Boster & Palinkas 2003).
The formal chart of a company and the network obtained by asking each employee, “With whom do you discuss work-related issues?” Central individuals (who receive most nominations) are NOT the formal leaders.
The research and consultancy activity that built on these ideas had a strong impact on organisational culture worldwide, especially as companies tended to flatten and rely on teams and cross-divisional, project-based work, so that managers’ authority mattered less and understanding these informal networks became a potential key for success. Many would admit today that the organisational chart is the fantasy of the employer, not an actionable tool, and even less so a reliable reflection of reality. But then, what are the advice, trust, and communication networks mapped by the researcher – shouldn’t we say they are the fantasy of the sociologist? These networks are built from questionnaires and therefore rely on the subjective responses of participants; and it is well known in the area of survey design research, that question wording orients responses, that different cultures and groups tend to interpret questions differently, and that people may give biased answers due to forgetting, deliberate concealing of sensitive information, ambiguity of definitions, and diversity in perceptions. The survey is the traditionally primary tool of investigation of the social networks scholar, but brings with it its limitations and distortions.
One may think that the formal organisational chart and the informal advice (or trust or communication) network are just two different ways of construing social structure and objectivating it. They are informed by different political and epistemological orientations: those of (old-style) employers for the former, those of social researchers (and perhaps enlightened employers) for the latter. The resulting formal-informal dichotomy would then be the result of a cleavage between two competing approaches to the management of organisations (and more generally of human groups or communities), one more hierarchical and functional, the other flatter and more collaborative.
Our new book Against the Hypothesis of the End of Privacy is out now! It has been published by Springer and co-authored with Antonio A. Casilli (Telecom ParisTech) and Yasaman Sarabi (University of Greenwich). Please check here for regular updates about the book.