Today, my chapter on “Formalization and mathematical modelling” is published in a new series of three reference books on History of Economic Analysis (edited by G. Faccarello and H. Kurz, Edward Elgar). The chapter draws heavily on key ideas I developed as part of my thesis on the origins of mathematical economics. But this was a long time ago and reading it again today, I see it in a different light. I notice in particular that economics developed its distinctive mathematical flavour, which makes it neatly stand out relative to the other social sciences, at times in which social research was data-poor – and it did so not despite data paucity, but precisely because of it. William S. Jevons, a 19th-century forefather of the discipline who was clearly aware of the relevance of maths, wrote in 1871:
“The data are almost wholly deficient for the complete solution of any one problem”
yet:
“we have mathematical theory without the data requisite for precise calculation”
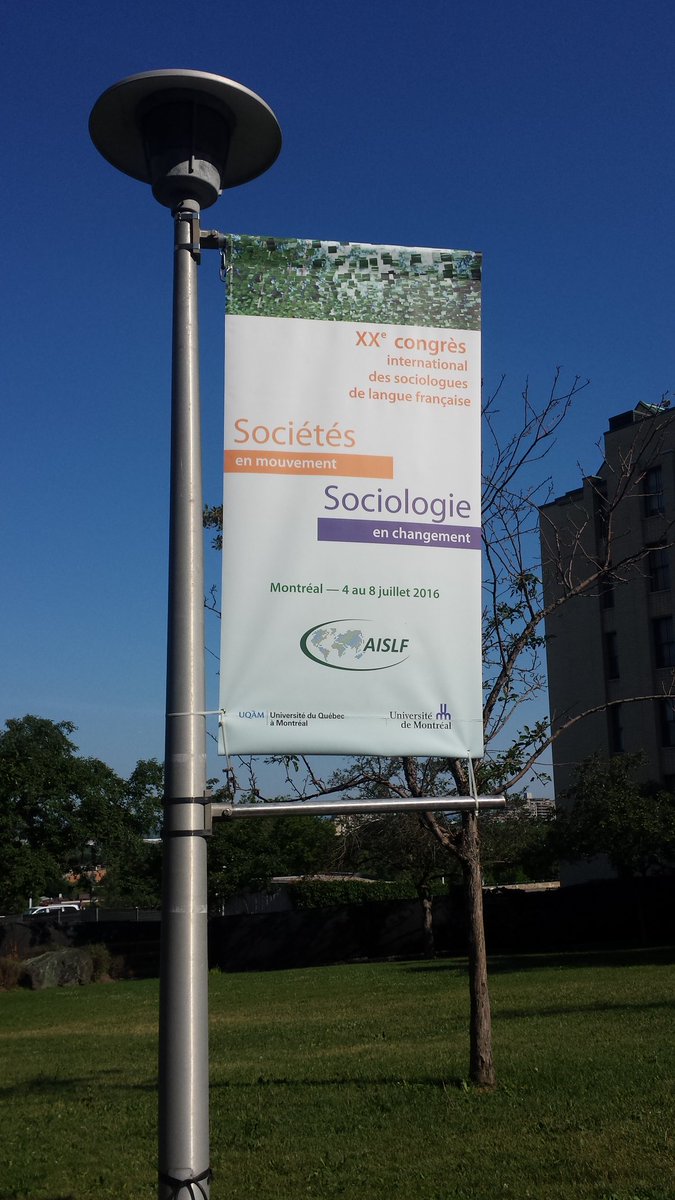
Just attended the 20th conference of AISLF, the international association of French-speaking sociologists, in Montréal. Back home yesterday I found a state of fear and madness (again, alas…). But before that, I enjoyed a nice time with fellow researchers from France and (perhaps even more intriguingly, or simply more newly) from the different countries in which French is spoken, ranging from Canada, Belgium and Switzerland to several African countries. It was a good opportunity to get a sense of what research is done around us.
Credit: @ArthurRenault on Twitter (#AISLF2016)
Lots of good presentations. Interestingly, digital sociology appears to be on the up, as many researchers investigated topics that had to do with digital technologies, their usages, and the ensuing economic and social transformations. That there was no dedicated stream is not in itself a problem: if digital technologies permeate all our lives, they should not be studied in a separate subfield but as part of the sociology of work, of gender, of education etc.
The other good thing is the emergence of social networks research in two keynote presentations – by Antonio A. Casilli and Michel Grossetti – which is far from a small achievement, considering that the association does not have a dedicated social networks research group (I would love to see one being created sooner or later… like BSA-SNAG, the group I convene for British Sociological Association).
The five papers in this peer-reviewed special issue explore the potential of visual tools to accompany qualitative and mixed-methods research. Visualization can support data collection, analysis and presentation of results; it can be used for personal or complete networks; it can be paper-and-pencil or computer-based. Overall, visualization helps to jointly understand network contents and network structures.
The special issue is freely accessible from all commercial (non-academic) internet providers.
Twitter conversations are one way through which participants in an event engage with the programme, comment and discuss about the talks they attend, prolong questions-and-answers sessions. Twitter feeds have become part of the official communication strategy of major events and serve documentation and information purposes, both for attendees and for outsiders. While tweeting is becoming more an more a prerogative of “official” accounts in charge of event communication, it is also a potential tool in the hands of each participant, allowing anyone to join the conversation at least in principe. Participants may become aware of each other, perhaps using the opportunity of the event to meet face-to-face, start relationships and even collaborations. A Nesta study insisted on the potential for using social media data to attain a quantitative understanding of events and their impacts on participants’ networks.
The OuiShare Fest 2016, a major gathering of the collaborative economy community that took place last week in Paris, was one opportunity to see such mechanisms in place. Tweeting was easy – with an official hashtag, #OSFEST16, although related hashtags were also widely used. I mined a total of 12440 tweets over the four days of the event. Do Twitter conversations related to the Fest bring to light the emergence of a community? While it’s too early for any deep analysis, some descriptive results can already be shown.
First, when did people tweet? Mostly at the beginning of each day’s programme (9am on the first two days, 2pm on the third day). Tweeting was more intense in the first day and declined over time (Figure 1). The comparatively low participation on the fourth day is due to the fact that the format was different – an open day in French (rather than an international conference in English), whereby local people were free to come and go. Online activity is not independent of what happens on the ground – quite on the contrary, it follows the timings of physical activity.
Figure 1: Tweets over time.
Who tweeted most? Our dataset has a predictable outlier, the official @OuiShareFest Twitter account, who published 727 tweets – twice as many as the second in the ranking. But let’s look at the people who had no obligation to tweet, and still did so: who among them contributed most to documenting the Fest? Figure 2 shows the presence of some other institutional accounts among the top 10, but the most active include a few individual participants. Ironically, one of them was not even physically present at the Fest, and followed the live video streaming from home. In this sense, Twitter served as an interface between event participants and interested people who couldn’t make it to Paris.
Figure 2: Ten most active tweeters (excluding @OuiShareFest).
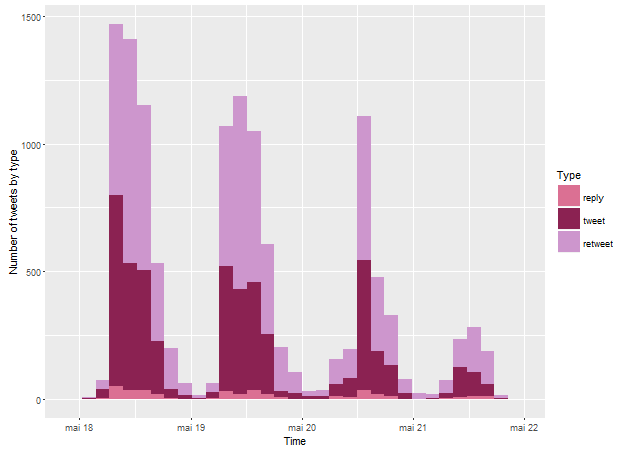
What was the proportion of tweets, replies and retweets? Original tweets are interesting for their unique content (what are people talking about?), while replies and retweets are interesting because they reveal social interactions – dialogue, endorsement or criticism between users. Figure 3 shows that the number of replies is small compared to tweets and retweets.
Figure 3: Tweets, replies and retweets
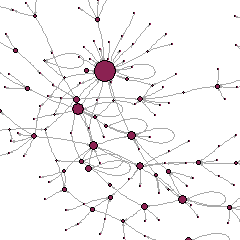
Let’s now look closer at the replies. By taking who replied to whom, we can build a social network of conversations between a group of tweeters. It’s a relatively small network of 311 tweeters (the coloured points in Figure 4), with 321 ties among them (the lines in Figure 4). The size of points depends on the number of their incoming ties, that is, the number of replies received: even if the points haven’t been labelled, I am sure you can tell immediately which one represents the official @OuiShareFest account… the usual suspect! But let’s look at the network structure more closely. Some ties are self-loops, that is, people replying to themselves. (Let’s be clear, it’s not a sign of social isolation, but simply a consequence of the 140-character limit imposed on Twitter: self-replies are meant to deliver longer messages). A lot of other participants are involved in just simple dyads or small chains (A replies to B who replies to C, but then C does not reply to A), unconnected to the rest. There is a larger cluster formed around the most replied-to users: here, some closure becomes apparent (A replies to B who replies to C who replies to A) and enables this sub-network to grow.
Figure 4: the network of replies.
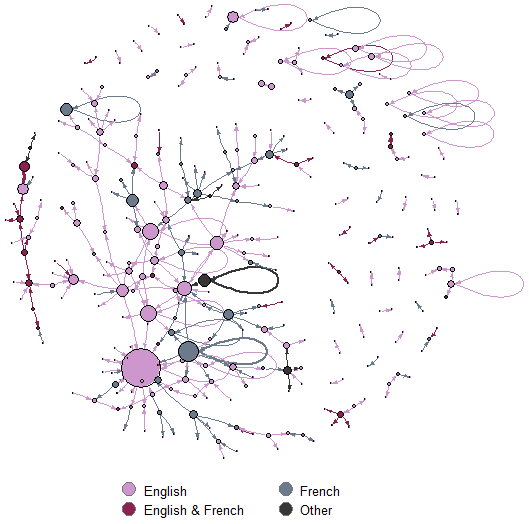
Now, my own experience of tweeting at the Fest suggested that tweets were multilingual. Apart from the fourth day, there seemed to be a large number of French-speaking participants. A quick-and-dirty (for now) language detection exercise revealed that roughly 60% of tweets were in English, 25% in French, the rest being split between different languages especially German, Spanish, and Catalan. So, did people reply to each other based on the language of their tweets? It turns out that quite a few tweeters were involved in conversations in multiple languages. Figure 5 is a variant of Figure 4, colouring nodes and ties differently depending on language. A nice mix: interestingly, the central cluster is not monolingual and in fact, is kept together by a few, albeit small, multi-lingual tweeters.
Figure 5: the network of replies, by language.
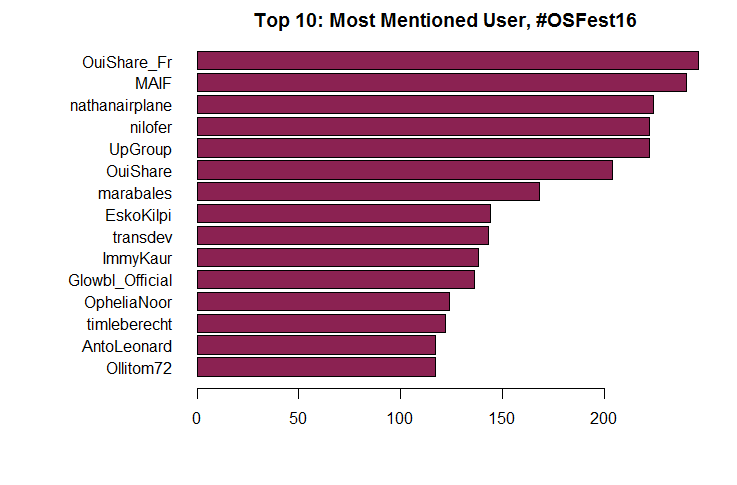
Let’s turn now to mentions: who are the most mentioned tweeters? Again, I’ll take out of the analysis @OuiShareFest, hugely ahead of anyone else with 832 mentions received. Below, Figure 6 ranks the most mentioned: mostly companies (partners or sponsors of the event such as MAIF), speakers (such as Nathan Schneider, Nilofer Merchant), and key OuiShare personalities (such as Antonin Léonard). Mentions follow the programme of the event, and most mentioned are people and organizations that play a role in shaping it.
Figure 6: Most mentioned tweeters.
Mentions are also a basis to build another social network – of who mentions whom in a tweet. This will be a larger network compared to the net of replies, as mentions can be of many types and also include retweets (which as we saw above, are very numerous here). There are 17248 mentions (some of which are repeated more than once) in the network. They involve 796 users who mention others and are mentioned in turn; 550 users who are mentioned, but do not mention themselves; and 1680 users who mention others, but are not themselves mentioned.
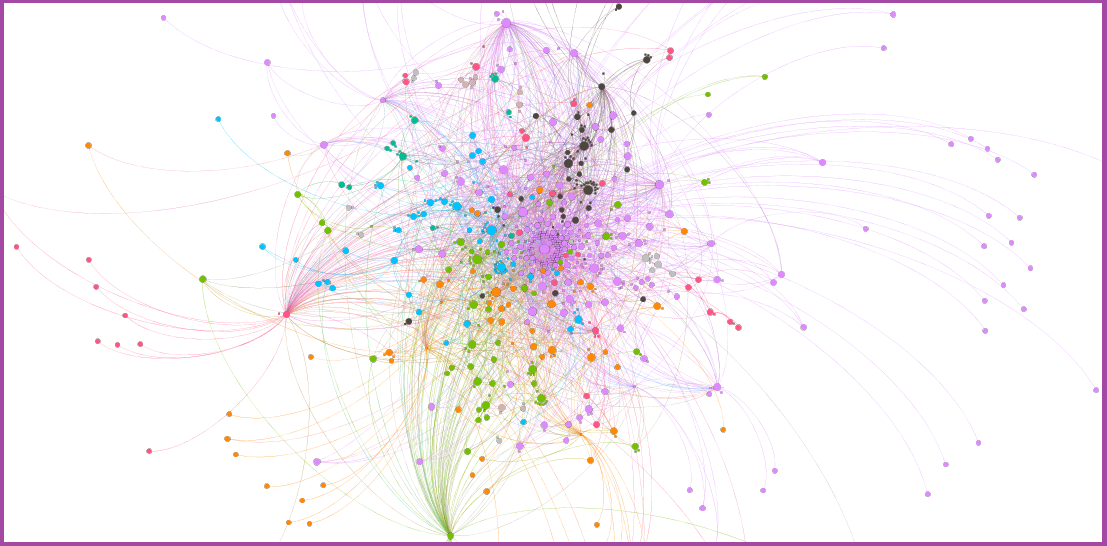
A large network such as this is more difficult to visualize meaningfully, and I had to introduce some simplifications to do so. I have included only pairs in which one had mentioned the other at least twice: this makes a network of 778 nodes with 2222 ties. The color of nodes depends on their modularity class (a group of nodes that are more connected with one another, than with any other nodes in the network) and their size depends on the number of mentions received. You will clearly recognize at the center of the network, the official @OuiShareFest account, which structures the bulk of the conversations. But even intuitively, other actors seem central as well, and their role deserves being examined more thoroghly (in some future, less preliminary analysis).
Figure 7: Network of Twitter mentions
This analysis is part of a larger research project, “Sharing Networks“, led by Antonio A. Casilli and myself, and dedicated to the study of the emergence of communities of values and interest at the OuiShare Fest 2016. Twitter networks will be combined with other data on networking – including informal networking which we are capturing through a (perhaps old-fashioned, but still useful!) survey.
The analyses and visualizations above were done with the packages TwitteR and igraph in R; Figure 7 was produced with Gephi.
Antonio A. Casilli and I carried out a study during the OuiShare Fest 2016, a major international get-together of the collaborative economy community that took place in Paris on 18-21 May 2016.
Our goal is to look at how people network at this important event and how their meetings, their talking to each other and their informal interactions help shape the community — so as to foster the emergence of new ideas, trends and topics.
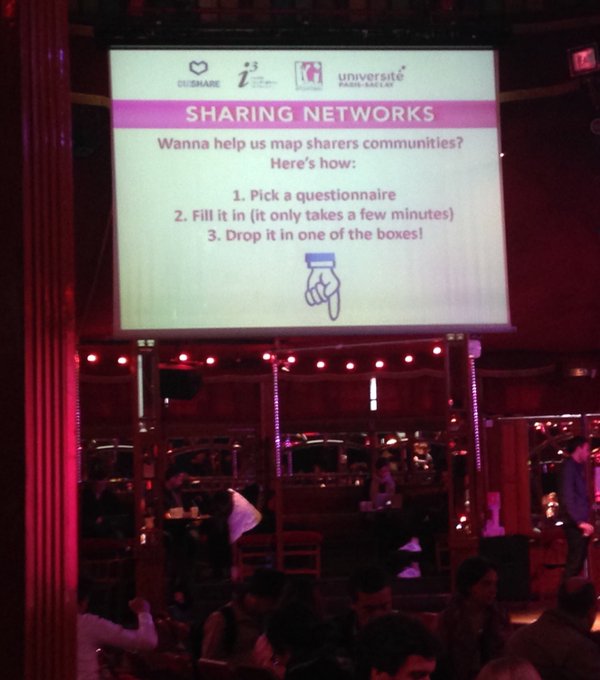
If you were a participant, speaker, journalist organizer or team member/volunteer, you were asked to complete a brief questionnaire in paper format that was handed out to you upon arrival at the Fest.
If you didn’t manage to fill in the questionnaire onsite, there is still time to do so online. It takes only about 8 minutes to do so and your contribution will help scientific research as well as the organization of the Fest.
Results will be made available through the OuiShare Magazine and other online outlets.
Some time ago, I wrote a post on ethical issues in research with secondary data – a somewhat grey area, where students and scholars often feel guidance is insufficient. Even more complex is research with internet data – neither primary nor secondary strictly speaking, but “big” data. A recent case fuelled an international debate on how researchers should deal with data that are, apparently, accessible to all on the web: a Danish graduate student published a large dataset of users of the online dating site OkCupid (he apparently did so without any institutional backing, and Aarhus University where he studies, is now on the case). Michael Zimmer, a specialist of information studies and the policy and ethics of online research, properly summarizes the issues in a recent Wired article:
Don’t say that “the data are already public”. The fact that OkCupid users knowingly share some personal information, does not mean they consent to it being used for purposes other than interactions with other users on that site. By scrapping data, one may be able to put together the whole history of users’ presence on that platform, revealing more of their life or personality than they themselves are aware of. More dangerously, data extracted in this way might in some cases be matched with other information, thereby potentially becoming much more disclosive than what the persons concerned ever intended or agreed. And the disclosure may be aggravated by releasing the data outside the platform.
The concept of “data inclusion” is new and still slowly seeking its way in our linguistical habits, but it is gaining ground in the minds of those who care for disadvantaged, low-income, or otherwise underserved segments of society. A recent report of the US Federal Trade Commission (FTC) does precisely this. Looking at the commercial use of big data analytics, it considers cases in which big data analytics lead companies to make choices that are detrimental to the most vulnerable segments of society, for example by excluding them from credit or from employment opportunities. Instead, it asks how big data may be used in inclusive ways.
A first set of recommendations they make is for companies to be well aware of the regulations: on financial and credit reporting, equal opportunities, consumer protection. The second set of recommendations, though specifically aimed at research done in (or for) companies, is of relevance for public research as well, and consists in asking key questions about the quality of data and models, and about the reliability and validity of results:
How representative is your data set? In popular discourse, big data carry a promise of exhaustivity, which however is rarely fulfilled in practice (see this great FT article by Tim Hartford). In fact, big data sets are not necessarily statistically representative of the population they refer to, and information may be disproportionately missing about specific, possibly disadvantaged, populations.
Does your data model account for biases? Selection effects, which occur whenever some members of the population are less likely to be included in the sample than others, must be controlled for in order for results to be generalizable.
How accurate are your predictions based on big data? The issue is that most research with big data is predictive without being able to uncover the social or economic mechanisms underlying observed correlations, so that interpretation of results is potentially misleading. The report does not say, though, that recent developments in machine learning that support causality reasoning may alleviate this problem in the not-so-far future.
Does your reliance on big data raise ethical or fairness concerns? In all honesty, this is not specifically a question for research on big data, but for research in general. If a company’s analysis of employees’ behavior lead to solutions that involve forms of, say, racial or gender-based behavior, then that analysis shouldn’t be used – whether it’s done with “big” or “small” data.
It is important that major regulators like the FTC are taking notice. Big data open the way to major improvements in our life conditions, but not because data-driven analysis will take the lead over current best practices in research. Regulations, awareness of statistical issues and potential pitfalls, and ethics are ever more necessary for big data to fulfill their potential.
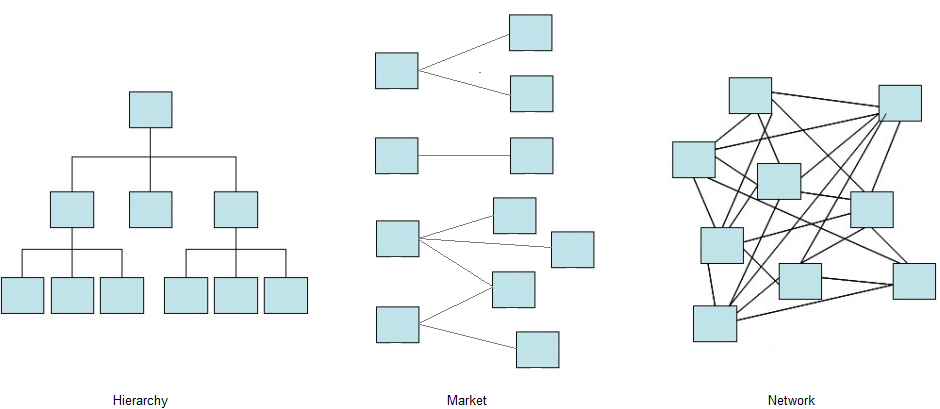
Economics traditionally considered firms and markets as two alternative ways of coordinating economic activities. Nobel prize winner Ronald H. Coase (1937) demonstrated that it all hinges on “transaction costs”, such as the need to search for a trade partner, the time needed to negotiate a contract, the legal expenses to draw it up and if necessary, to enforce it. When these costs are high, then hiring people in a firm is the right solution. When they are low, then a harmonious state will emerge spontaneously from the choices of independent, self-employed individuals. The difference, further emphasized by the work of Oliver Williamson, another Nobel, is between the world of bureaucracy, hierarchy and salaried work, and the world of the market and myriad micro-entrepreneurs.
This dichotomous description seemed reductive to economic sociologists, and Mark Granovetter (1985) pointed to social networks as coordination devices. Networks enable circulation of knowledge, formation of trust, emergence of shared norms in informal ways, thereby lowering costs and smoothing economic transactions. Walter W. Powell (1990) saw networks as an alternative to market and hierarchy, while others thought of it as a complement rather than a substitute. In some cases, the relevance of networks is flagrant: think of “collegial“, horizontal organizations such as legal partnerships, which are clearly not markets, and which have no vertical hierarchy either.
The rise of online platforms challenges these older views today. Powered by digital data and matching algorithms, platforms are meeting places for actors on the two sides of a market: riders and drivers (Uber, Lyft, BlaBlaCar), guests and hosts (Airbnb), buyers and sellers (eBay), and so on. Officially, platforms are intermediaries only, able to put in touch, say, those who need a lift and those who have a car, so that they can share the ride. Platforms don’t employ drivers and don’t own cars.
I am lucky enough to be part of the organizing committee of the second European Social Networks Conference, which will take place at Sciences Po Paris on 14-17 June 2016. The EUSN conferences have been created to offer a single place for the European community of social networks researchers to gather, in place of previous national annual conferences; and has been endorsed as a regional conference by INSNA, the international association of network researchers. A first, successful EUSN conference was held in Barcelona in 2014.
Somehow, the European social networks crowd seems more diverse than the US-based core of scholars who gave life to INSNA and drove its development over time. While remaining affectionate to the INSNA format and philosophy (for example, by selecting proposals only on the basis of an abstract, to be maximally inclusive), the European conferences can afford exploring new ideas, and variants on classical schemes. In particular, this year, we are trying to enlarge patricipation and attract delegates from a wider variety of disciplines, beyond those traditionally most represented – the social sciences, mathematics, and more recently statistics. Hence for example, the keynote speakers will give a sense of continuity – we will have social anthropologists Miranda Lubbers and José Luis Molina, the organisers of the first EUSN in Barcelona, on “Ethnography and multilevel networks in the study of migration and transnationalism”. But the plenary speech is an opening to recent, relevant developments in computer science: Jean-Daniel Fekete of INRIA will talk about “Challenges in social network visualization: bigger, dynamic, multivariate”.
Submissions are now invited for paper and poster proposals (abstract only – deadline 16 February 2016). There are special thematic sessions and general sessions, and all fields are welcome. A prize will be awarded for the best poster – where all participants will be able to vote.
The day before the conference, 15 training workshops are offered into the theory, data collection, methods of analysis and visualization of social networks.
IMPORTANT DATES:
16 February: Deadline for abstract/poster proposals, and pre-registration opening
1 March: Registration opening
16 March: Notification to authors
18 April: Early registration closure
14 June: Workshops
15-17 June: Conference
Yes I must admit it: I didn’t keep my new-year-2015 promise of posting more often on my blog… and the annual report I received yesterday from WordPress, showing a couple of peaks of activity and frigthening silence the rest of the year, isn’t something I would be proud to share… but I have a justification! Seriously, it’s not just an excuse – it’s that I’ve been busy trying to change life… and yes, I managed. On Monday 4 January, I’ll start an exciting new position as senior research scientist at the National Center of Scientific Research (CNRS, or in French, Centre national de la recherche scientifique) in Paris. CNRS can be loosely compared to what is, in other countries, a National Research Council, but there’s more to it than international comparisons might vaguely suggest: this is probably the single most desired job in French academia, with a mission “to contribute to the development of knowledge… in all fields that contribute to the advancement of society“. In plain words, that’s basically pure research with almost no teaching apart from some PhD supervision… a dream that would hardly be possible in the UK, where I was before.
I’ll be at the Lab for Computer Science (LRI, Laboratoire de Recherche en Informatique, UMR8623) on the Saclay campus, and I’ll work with the A&O (Learning and Optimization) research team. The interesting thing is that mine is an interdisciplinary position, designed to facilitate dialogue and collaboration between the social sciences and computer science around big data and their use for the advancement of knowledge, policy, and more generally society. I have been especially selected by the sociology section of CNRS to work in a computer science research centre. There, I am asked to develop my personal, long-term research project on the “sharing economy” of digital platforms and how they create value from the social ties in which economic action is embedded: this will require blending my research on data, social networks and the digital economy with machine learning and optimization approaches (more on this later … yes on this blog! promise!).
What else will I do this year at LRI? I am in the organising committee of the Second European Social Networks Conference which will take place in Paris next June, I am finishing a book on so-called “pro-anorexia” websites as the conclusion of my past project ANAMIA, and I am in the Editorial Board of Revue Française de Sociologie.
I won’t entirely forget England though… I’ll keep my doctoral students at Greenwich and continue my engagement at UCL’s Institute of Education as external examiner. Come on, you can’t just disappear after six years! Indeed, I’ll always remember those six years as most productive and fulfilling ones. And however happy I am now to join CNRS, I’ll never forget the expressions of love, sympathy and friendliness I received from colleagues and students when I left Greenwich in December. The cards, the presents, the parties… all beyond any expectations I might have had before! Thank you Greenwich. And well, yes, a big thank you to all those who made it possible – both those in London who made me have a great time far from home for so long, and those in Paris who helped me come back, not without effort, and have welcomed me now.
A great new year is about to start, and I promise I’ll document it more… 😉
 Today, my chapter on “Formalization and mathematical modelling” is published in a new series of three reference books on History of Economic Analysis (edited by G. Faccarello and H. Kurz, Edward Elgar). The chapter draws heavily on key ideas I developed as part of my thesis on the origins of mathematical economics. But this was a long time ago and reading it again today, I see it in a different light. I notice in particular that economics developed its distinctive mathematical flavour, which makes it neatly stand out relative to the other social sciences, at times in which social research was data-poor – and it did so not despite data paucity, but precisely because of it. William S. Jevons, a 19th-century forefather of the discipline who was clearly aware of the relevance of maths, wrote in 1871: